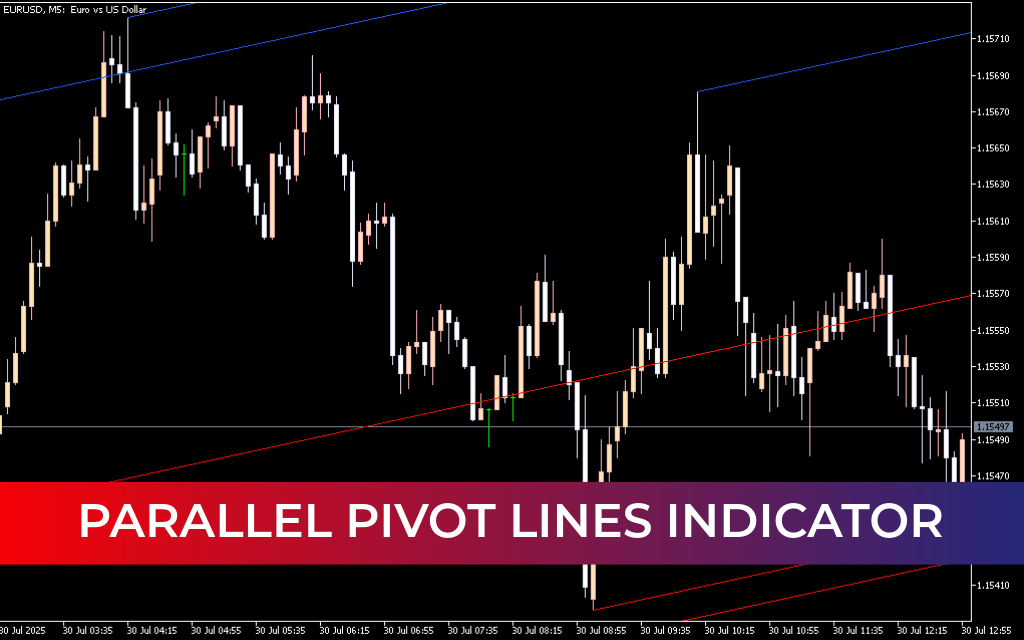
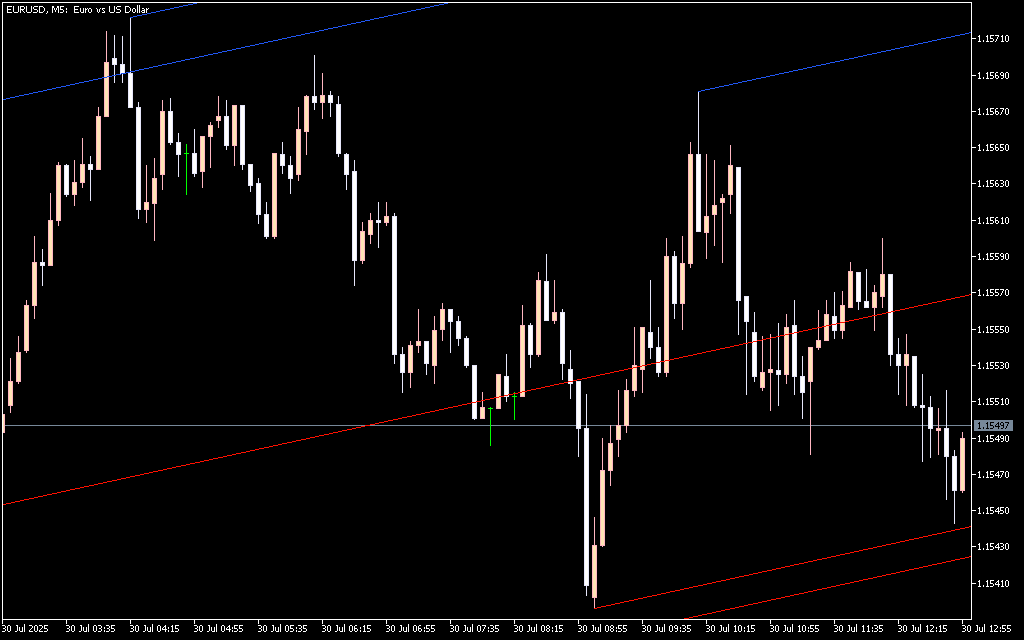
The Parallel Pivot Lines Indicator for MetaTrader 5 by LuxAlgo is a dynamic trend channel tool that plots parallel support and resistance lines based on evolving swing highs and lows. It provides traders with a real-time visual framework to understand Market Structure, anticipate reversals, and identify breakout zones without manual charting.
Key Features
1. Automated Parallel Channels
- Connects swing highs and lows to create upper and lower trendlines
- Adjusts automatically with Price Action to reflect current market sentiment
- Channels can indicate bullish, bearish, or neutral trend orientation
2. Dynamic Support & Resistance
- Upper line signals potential resistance or overbought conditions
- Lower line acts as support or oversold indicator
- Traders can use channels for bounces or breakout setups
3. Adjustable Parameters
- Slope and lookback settings allow fine-tuning for different market conditions
- Works across multiple timeframes for Scalping, day trading, or swing trading
- Channels adapt as new highs and lows form
4. Visual Clarity for Price Action Traders
- Clean, uncluttered overlay with automatically updating lines
- Helps identify trend corridors and structural shifts
- Supports momentum-based and channel breakout strategies
Why Traders Use This Indicator
- Simplifies tracking of evolving support and resistance zones
- Provides a clear visual guide for trend-following or reversal trades
- Reduces manual plotting and subjectivity in trendline analysis
- Enhances decision-making in breakout and momentum setups
Conclusion
The Parallel Pivot Lines Indicator MT5 by LuxAlgo offers automated channel visualization, helping traders clearly see evolving trend structures. With adaptive upper and lower lines, adjustable slope, and real-time updates, it’s a practical tool for identifying bounces, breakout opportunities, and structural shifts in trending markets.
FAQ
1 Download
Published:
Mar 02, 2026 12:09 PM
Category: