The Parabolic SAR Oscillator for MetaTrader 5 is an advanced Momentum Indicator that reimagines the classic Parabolic SAR in a cleaner and more analytical oscillator format. Developed by LuxAlgo, this tool converts SAR trend data into a dynamic histogram that helps traders easily detect momentum strength, trend exhaustion, and potential reversal zones.
Instead of plotting dots directly on the price chart, the oscillator visualizes SAR behavior within a structured range. This transformation reduces chart clutter while providing a more intuitive way to monitor market direction and momentum cycles.
Designed for both intraday and swing trading, the Parabolic SAR Oscillator delivers smoother, noise-filtered signals that help traders respond faster to changing market conditions.
How the Parabolic SAR Oscillator Works
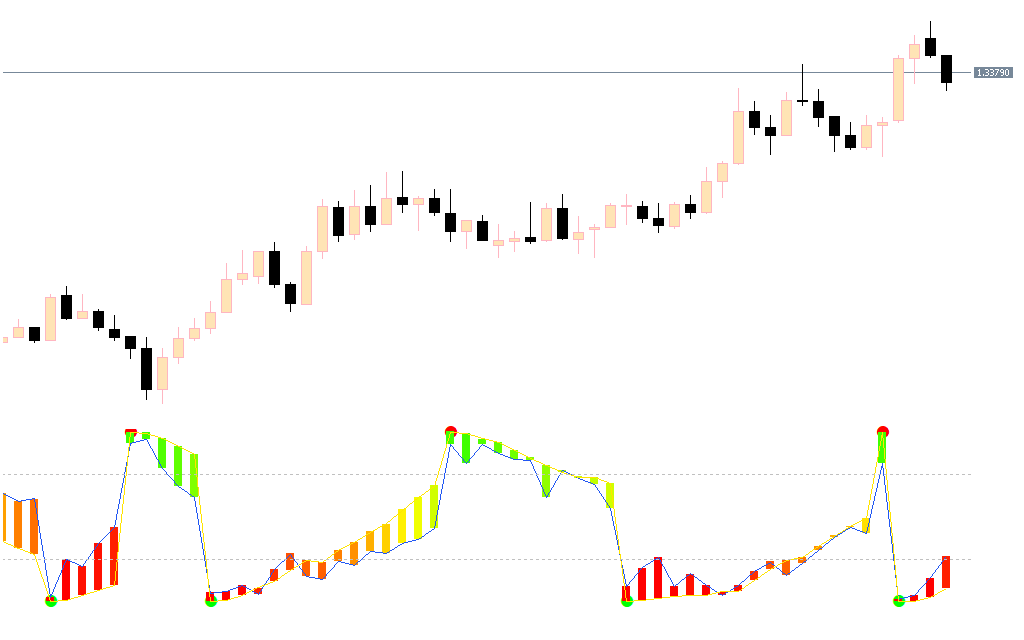
The indicator displays SAR-derived momentum as a histogram that fluctuates between defined upper and lower levels. These movements reflect changes in Trend Strength and potential turning points.
Bullish Exhaustion Signals
- Oscillator reaches extreme positive values
- Momentum begins to decline
- Red markers appear near cycle peaks
This often suggests weakening bullish pressure and the potential for a downward reversal.
Bearish Exhaustion Signals
- Oscillator drops to extreme negative values
- Momentum turns upward
- Green markers appear near cycle bottoms
These conditions can indicate fading selling pressure and the possibility of a bullish reversal.
Momentum Visualization
- Rising histogram bars indicate strengthening momentum
- Falling bars suggest weakening trend force
- Color shifts highlight directional changes instantly
This structure helps traders identify momentum cycles and react to early trend transitions.
Key Trading Benefits
The Parabolic SAR Oscillator enhances traditional SAR analysis by delivering clearer and more actionable insights:
✔ Oscillator format for easier momentum interpretation
✔ Reduced chart clutter compared to classic SAR dots
✔ Visual detection of overbought and oversold extremes
✔ Early warning of trend exhaustion and reversals
✔ Color-coded histogram for quick trend recognition
Practical Trading Applications
Traders commonly use this indicator to:
- Identify potential trend reversals
- Confirm momentum strength or weakness
- Spot overextended market conditions
- Time entries near cycle turning points
- Filter trend-following or counter-trend setups
When combined with support and resistance, trend structure, or volume confirmation, it becomes a powerful decision-support tool.
Conclusion
The Parabolic SAR Oscillator for MT5 delivers a modern and streamlined approach to momentum analysis. By transforming traditional SAR signals into an easy-to-read oscillator, it helps traders visualize trend strength, detect exhaustion, and anticipate reversals with greater clarity. Whether you trade trends or reversals, this indicator provides cleaner signals and improved timing for more confident decision-making.
FAQ
3 Downloads
Published:
Mar 01, 2026 09:59 AM
Category: