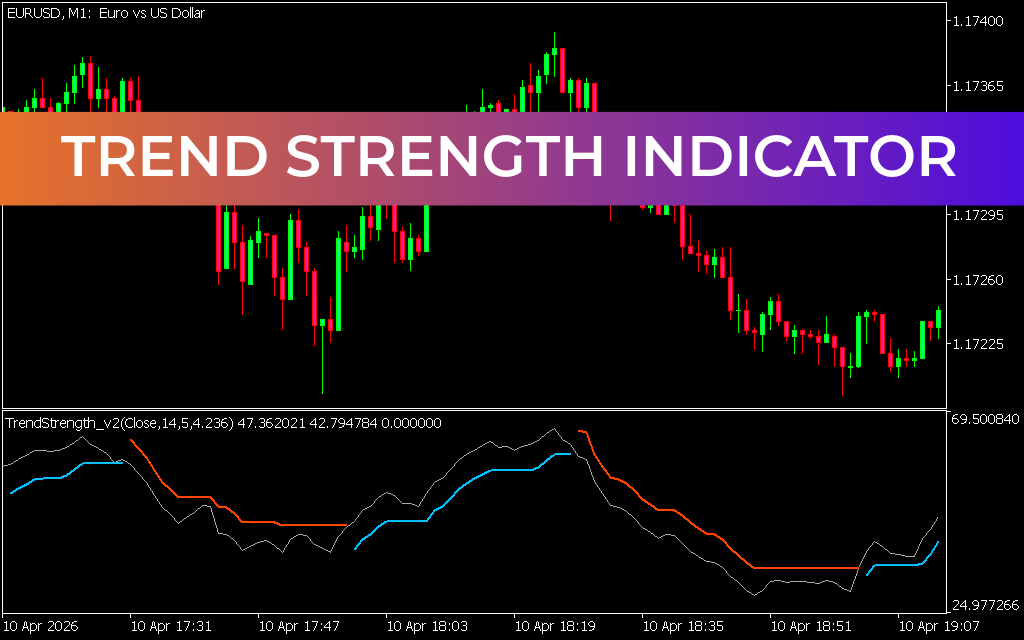
The Trend Strength Indicator for MT5 is a powerful trend-following tool designed to measure the strength and momentum of price movements. By combining Average True Range (ATR) and price standard deviation, this indicator helps traders identify whether the market is trending or ranging, making it easier to plan high-probability trades.
With its clear histogram display, traders can quickly understand market conditions and align their strategies accordingly.
What is the Trend Strength Indicator?
This indicator uses histogram bars to represent the strength of bullish and bearish forces in the market:
- Blue bars → Bullish momentum
- Crimson bars → Bearish momentum
The bars expand and contract depending on how strong or weak the current trend is.
Key Features
- Measures trend strength using ATR and standard deviation
- Displays momentum using color-coded histogram bars
- Identifies trending vs ranging markets
- Works on all timeframes (Scalping to swing trading)
- Suitable for beginners and advanced traders
- Can be used as a standalone or confirmation tool
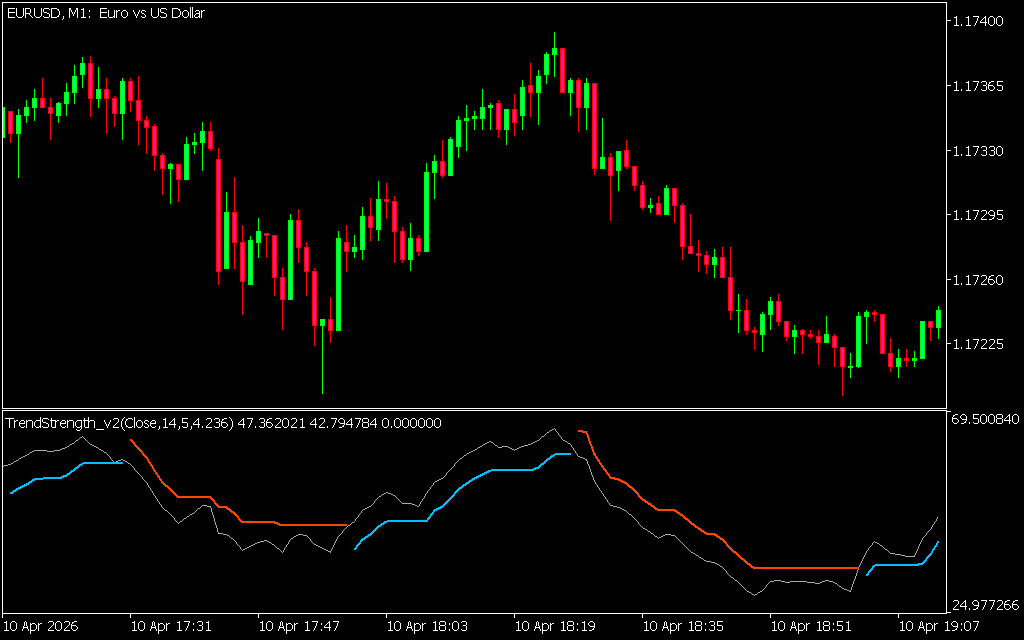
How the Indicator Works
The histogram fluctuates above and below a zero line, which acts as a key reference:
- Above zero → Trending market (bullish or bearish)
- Below zero → Weak or ranging market
This makes it easy to determine whether to enter trades or stay out during low-momentum conditions.
How to Trade with Trend Strength Indicator
Buy Signal (Bullish Setup)
- Blue histogram bars appear above the zero line
- Indicates strong bullish momentum
- Confirm with bullish Price Action (e.g., bullish engulfing candle)
👉 Enter a BUY trade
Stop Loss: Below recent swing low
Take Profit: Based on resistance or risk-reward ratio
Sell Signal (Bearish Setup)
- Crimson histogram bars appear above the zero line
- Indicates strong bearish momentum
- Confirm with bearish price action (e.g., bearish engulfing candle)
👉 Enter a SELL trade
Stop Loss: Above recent swing high
Take Profit: Based on support or risk-reward ratio
Identifying Market Conditions
- Strong trend: Large, expanding bars above zero
- Weak trend: Small or shrinking bars
- Sideways market: Bars moving below zero
👉 Avoid trading in low-strength (ranging) conditions for better accuracy.
Trading Tips
- Combine with:
- Support and resistance levels
- Candlestick patterns
- Trend-following indicators
- Use higher timeframes for stronger confirmation
- Ideal for:
- Scalping
- Intraday trading
- Swing trading
Why Use the Trend Strength Indicator?
This indicator helps traders:
- Measure real market momentum
- Avoid low-quality trades in ranging markets
- Improve timing for entries and exits
- Confirm trend strength before entering positions
Limitations
- May lag slightly in fast-moving markets
- Requires price action confirmation
- Not sufficient as a standalone strategy in all conditions
Conclusion
The Trend Strength Indicator for MT5 is an essential tool for traders who want to analyze momentum and trend quality effectively. By clearly showing whether the market is trending or ranging, it helps traders make smarter decisions and avoid unnecessary risks.
For best results, combine it with price action a
17 Downloads
Published:
Apr 12, 2026 17:45 PM
Category: