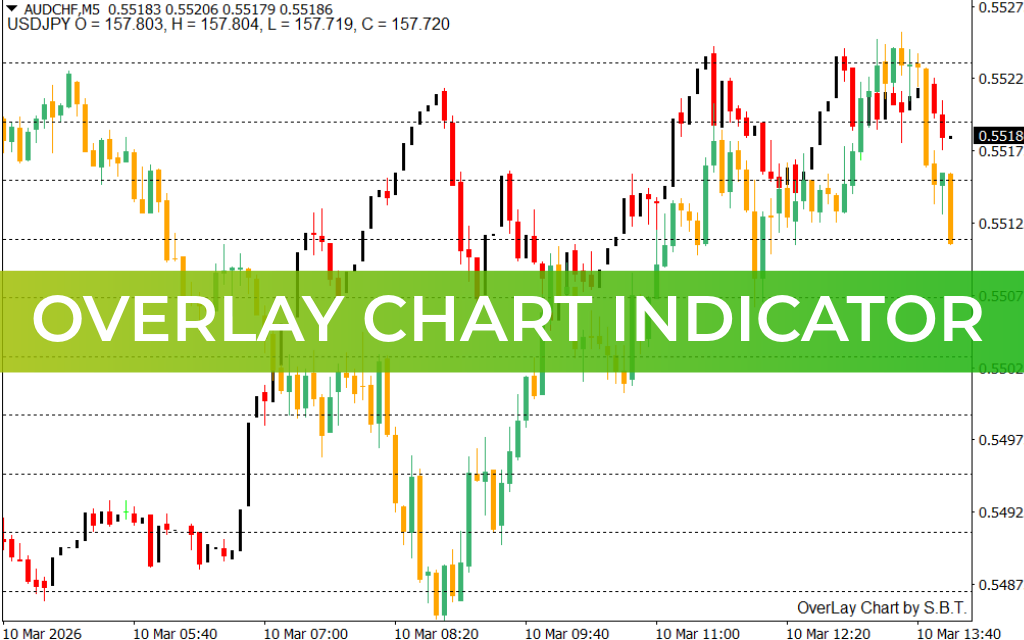
he Overlay Chart Indicator for MT4 is a practical tool for forex traders that allows you to compare the Price Action of two currency pairs simultaneously. By overlaying one pair on another, the indicator helps traders identify correlations and divergences, which can inform buy and sell decisions.
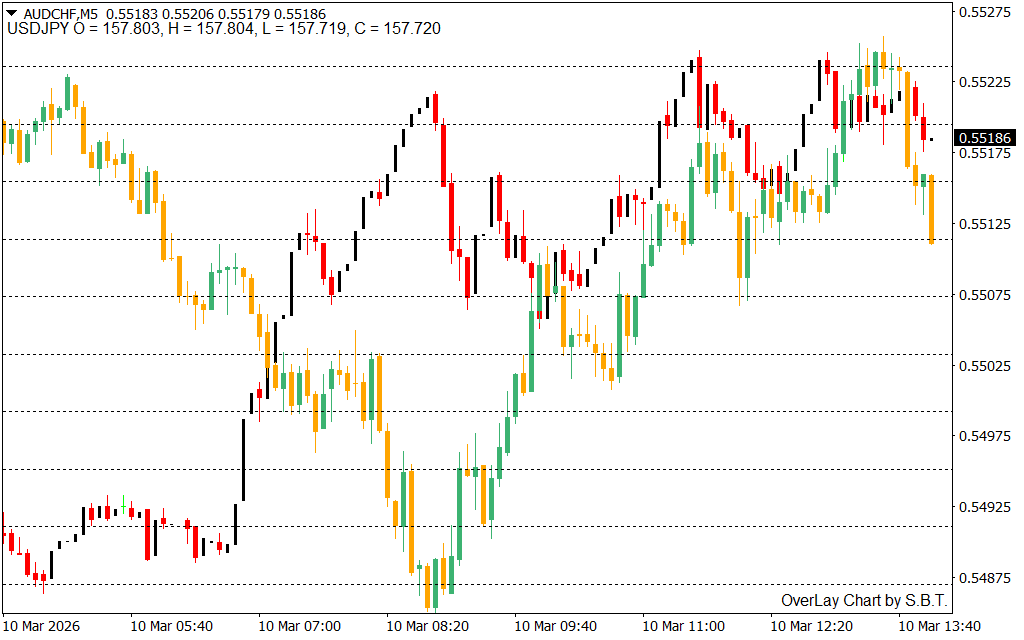
This indicator also plots the open, high, low, and close prices of the overlaid pair, providing a clear view of its market behavior relative to the original pair. It is particularly useful for trading strategies that rely on forex correlations, where pairs move in either the same or opposite directions:
- Positive Correlation: Both pairs move in the same direction.
- Negative Correlation: Pairs move in opposite directions.
The Overlay Chart Indicator works on all timeframes, though longer timeframes are recommended for more reliable signals.
How to Use the Overlay Chart Indicator
When applied to an MT4 chart, the indicator visually compares two currency pairs:
- Original Pair: Follow its price action to determine your trading direction.
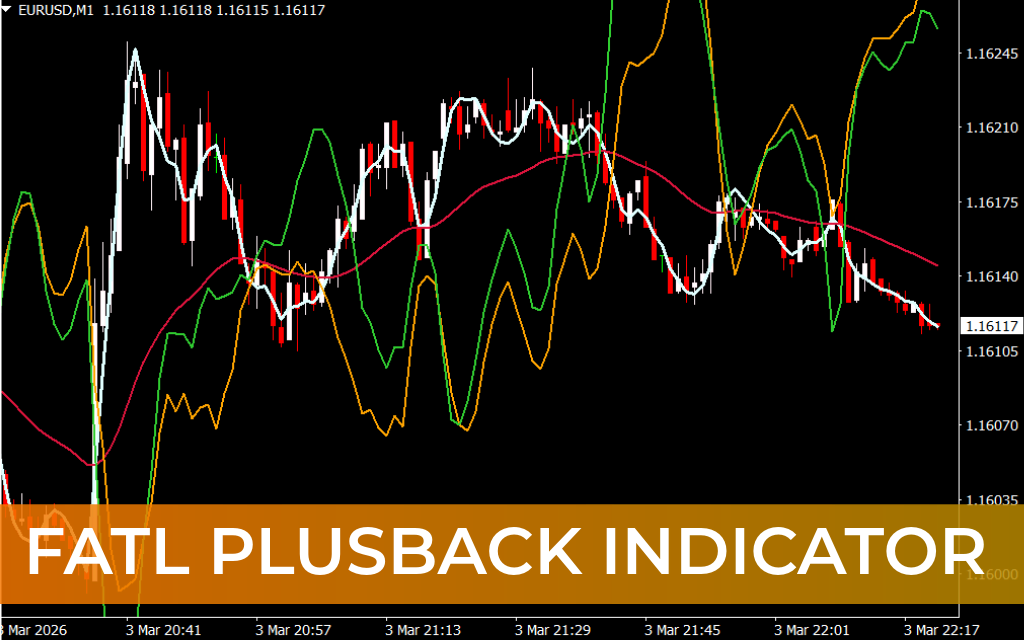
- Overlaid Pair: Displayed with green and orange bars to indicate bullish and bearish trends.
- Green Bars → Bullish trend
- Orange Bars → Bearish trend
Traders can take positions on both pairs by analyzing the correlation and trend alignment. For better trade accuracy, it is advised to combine the Overlay Chart Indicator with other technical indicators like RSI, MACD, or moving averages to determine precise entry and exit points.
What Is Overlay Analysis?
Overlay analysis involves plotting the price action of one asset over another to compare trends, reversals, and relative strength. Overlay indicators like this one allow traders to spot divergences, confirm correlations, and make more informed trading decisions.
Example
In a USD/CAD vs. USD/JPY overlay:
- If the overlaid USD/JPY shows green bars (bullish) while USD/CAD is also trending up, it confirms a positive correlation, suggesting stronger bullish momentum.
- Conversely, if the overlaid pair moves in the opposite direction, it indicates a negative correlation, helping traders anticipate possible retracements or trend shifts.
Why Use the Overlay Chart Indicator
- Compare two forex pairs simultaneously.
- Identify positive or negative correlations for better trading decisions.
- Analyze trend alignment and divergences across multiple pairs.
- Works on all timeframes and supports various trading styles.
- Compatible with additional technical indicators for precise entries.
Conclusion
The Overlay Chart Indicator for MT4 allows traders to overlay one currency pair over another and analyze correlations, trends, and divergences. By comparing two price actions, traders can make more informed buy and sell decisions. The indicator is free to download and easy to use for all levels of traders.
FAQ
5 Downloads
Published:
Mar 10, 2026 09:04 AM
Category: