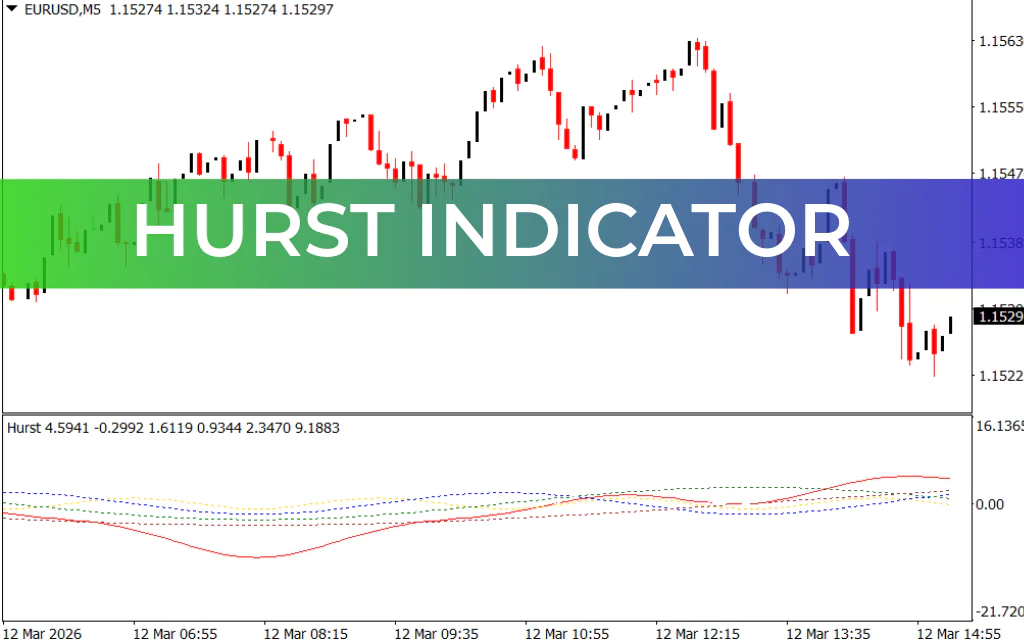
The Hurst Indicator for MT4 is a unique technical analysis tool that uses the concept of the Hurst Exponent to determine market trends and potential reversals. Designed for the MetaTrader 4 trading platform, the indicator analyzes price cycles and plots wave structures and time waves to help traders identify the direction and strength of the market trend.
This indicator measures whether the market is trending, unpredictable, or mean-reverting, making it a useful tool for traders who want deeper insights into market behavior. By analyzing the persistence of price movement, the Hurst Indicator helps traders find reliable buy and sell opportunities.
Understanding the Hurst Exponent
The Hurst Indicator is based on the Hurst exponent (H), which measures the nature of a time series and ranges between 0 and 1.
- H > 0.5 – Indicates a strong trending market where price tends to continue in the same direction.
- H < 0.5 – Suggests mean reversion, meaning the trend may weaken or reverse.
- H ≈ 0.5 – Indicates a random or unpredictable market with no clear trend.
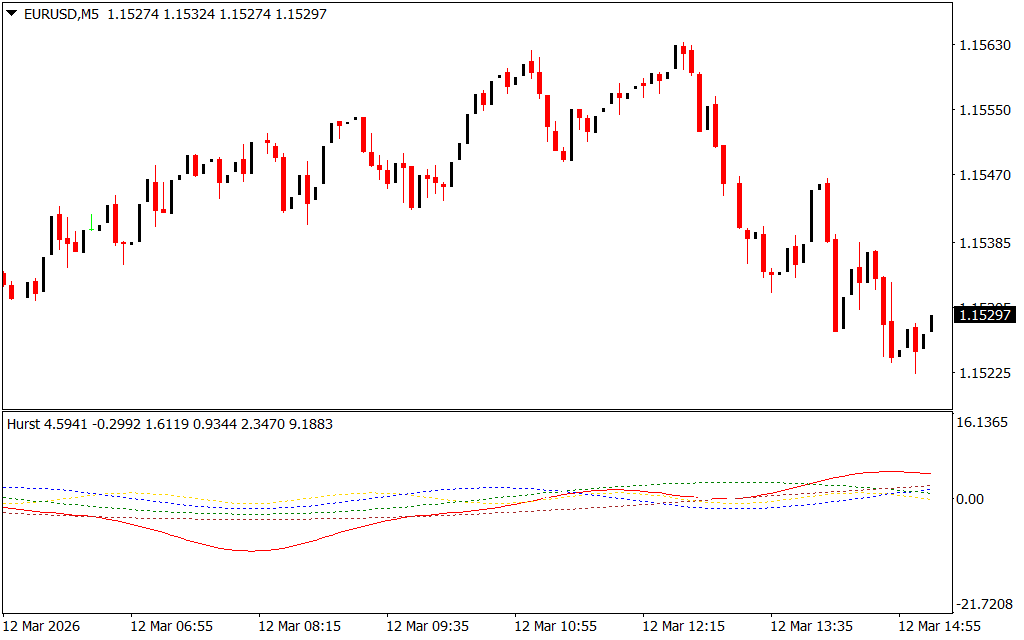
Unlike the traditional Hurst exponent representation, this MT4 indicator displays values oscillating between positive and negative levels, making it easier to interpret visually on a trading chart.
Wave Structure of the Indicator
The Hurst Indicator plots multiple waves that represent market cycles:
- W1
- W2
- W3
- W4
These wave patterns help traders identify market momentum and cycle direction.
The indicator also includes a time wave, which provides additional confirmation of trend direction.
Hurst Indicator Buy Signal
A Buy signal occurs when:
- The W3 wave drops below W1, W2, and W4
- The time wave is pointing upward
This pattern suggests that bullish momentum is building and the market may start moving upward.
Trading approach:
- Wait for confirmation of the wave structure.
- Enter a Buy trade once bullish momentum appears.
- Place a stop loss below the recent swing low.
Hurst Indicator Sell Signal
A Sell signal occurs when:
- The W3 wave rises above W1, W2, and W4
- The time wave indicates downward movement
This combination signals a potential bearish trend.
Trading approach:
- Confirm the bearish wave structure.
- Enter a Sell trade when the trend begins to move downward.
- Set a stop loss above the recent swing high.
Advantages of the Hurst Indicator
Traders use the Hurst Indicator because it offers several benefits:
- Identifies trend persistence and reversals
- Provides clear buy and sell signals
- Uses wave-based cycle analysis
- Works across multiple timeframes
- Helps identify entry and exit points
When combined with Support And Resistance levels, price action, and trendlines, the indicator can significantly improve trading accuracy.
Conclusion
The Hurst Indicator for MT4 is a powerful tool for traders who want to analyze market cycles and trend persistence using the Hurst exponent method. By plotting wave structures and time waves, the indicator helps traders identify trend direction, potential reversals, and optimal trading opportunities.
Because of its analytical approach, it can be particularly useful for traders who want to understand market behavior beyond traditional indicators. Best of all, the indicator is available for free and easy to install on MetaTrader 4.
FAQ
114 Downloads
Published:
Mar 12, 2026 10:17 AM
Category: