The OBV Indicator for MT4 (On Balance Volume) is a powerful volume-based trading tool used to measure the relationship between price movement and trading volume. It is based on the principle that volume precedes price, meaning changes in trading volume can often signal upcoming price movements.
By analyzing the difference between buying and selling volume, the indicator calculates the net volume flow and plots it as a line on the chart. This helps traders identify Trend Strength, potential reversals, and market momentum.
Because of its simplicity and reliability, the OBV Indicator is widely used by both beginner and advanced forex traders.
What Is the OBV Indicator?
The On Balance Volume (OBV) Indicator measures buying and selling pressure by accumulating volume data based on price direction.
The concept is straightforward:
- When price closes higher, volume is added to the OBV value.
- When price closes lower, volume is subtracted from the OBV value.
This calculation produces a line that reflects whether buyers or sellers dominate the market.
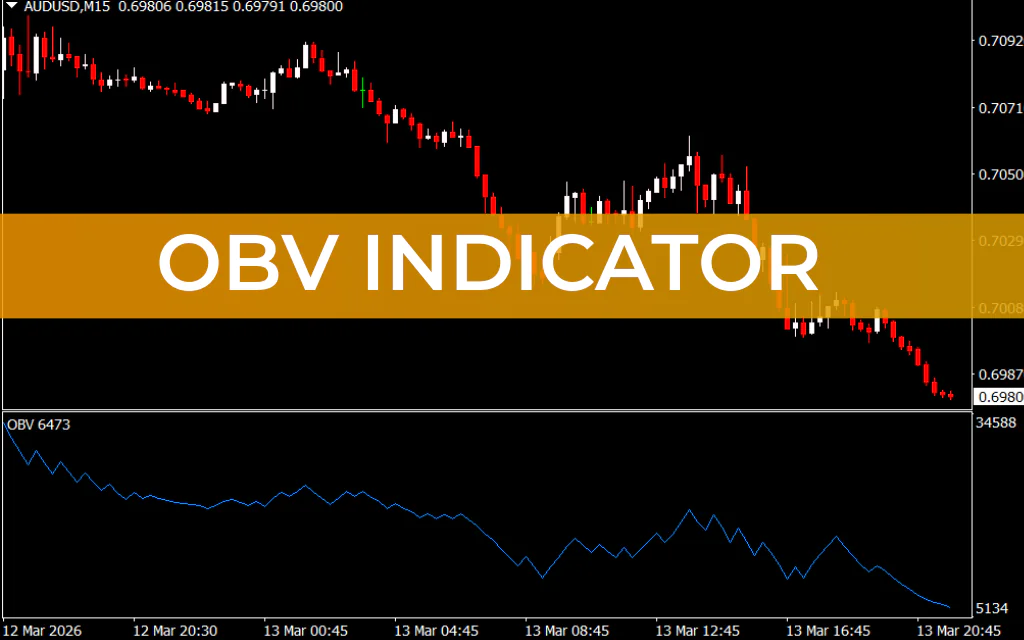
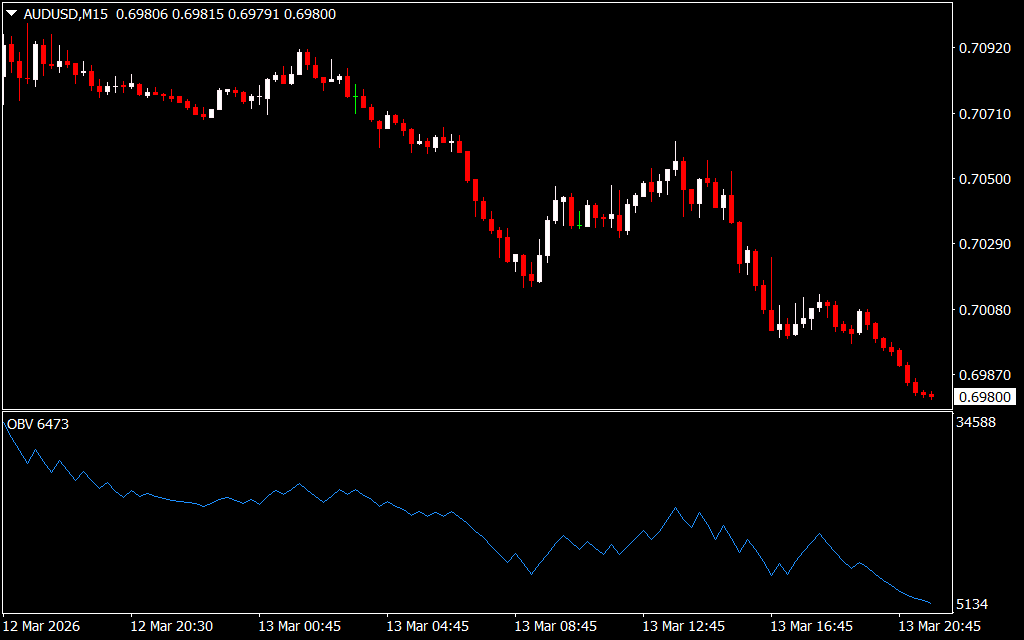
The indicator appears in a separate window below the main chart and is typically displayed as a blue line representing volume momentum.
How the OBV Indicator Works
The OBV line moves according to market sentiment:
- Rising OBV Line – indicates increasing buying pressure and a bullish trend
- Falling OBV Line – indicates increasing selling pressure and a bearish trend
- Flat or ranging OBV Line – suggests a neutral or sideways market
These signals help traders decide when to enter trades or stay out of the market during uncertain conditions.
OBV Indicator Trading Setup
When applied to a chart such as GBP/USD on the H4 timeframe, the OBV indicator appears in a separate panel below the price chart.
Bullish Setup (Buy Trade)
When the OBV line moves upward, it indicates increasing buying pressure.
Traders may consider:
- Opening a buy position
- Placing a stop loss below the previous swing low
- Taking profit when the OBV line starts weakening or reverses direction
This strategy allows traders to follow the trend while managing risk.
Bearish Setup (Sell Trade)
When the OBV line moves downward, it indicates growing selling pressure.
In this scenario, traders may:
- Enter a sell position
- Place a stop loss above the previous swing high
- Take profit when the OBV line starts turning upward
This helps traders capture downward market momentum.
Trading Trend Line Breakouts with OBV
Another effective strategy involves drawing trend lines on both the price chart and the OBV indicator.
In many cases, the trend line on the OBV indicator breaks around the same time as the price trend line. This simultaneous breakout suggests a shift in market volume and momentum.
When this happens, it often signals a strong potential entry point.
In this strategy:
- Trend lines act as Support And Resistance levels
- Breakouts can indicate trend reversals or continuation
Using OBV for Divergence Trading
The OBV indicator can also be used to identify divergence between price and volume.
Bullish Divergence
Occurs when price makes lower lows, but the OBV indicator forms higher lows. This suggests weakening selling pressure and a possible upward reversal.
Bearish Divergence
Occurs when price makes higher highs, but the OBV indicator forms lower highs. This indicates weakening buying pressure and a potential downward reversal.
Divergence signals can provide early warnings of trend changes.
Multi-Timeframe Trading with OBV
Forex traders can also apply the OBV indicator in multi-timeframe trading strategies.
For example:
- Use a higher timeframe (such as H4 or Daily) to determine the overall volume trend.
- Use a lower timeframe (such as M15 or H1) to find precise entry points.
This method helps traders align their trades with the dominant market direction.
Key Benefits of the OBV Indicator
- Measures buying and selling pressure
- Identifies bullish and bearish trends
- Helps detect trend reversals
- Supports divergence and breakout trading strategies
- Useful for multi-timeframe analysis
- Suitable for both beginners and advanced traders
Final Thoughts
The OBV Indicator for MT4 is a valuable tool for understanding market momentum through volume analysis. By tracking the relationship between price movement and trading volume, the indicator helps traders identify strong trends, potential reversals, and high-probability trading opportunities.
It also allows traders to apply various strategies such as trend line trading, breakout strategies, divergence analysis, and multi-timeframe trading.
Since the indicator is free to download and easy to install, it can be a useful addition to any trader’s technical analysis toolkit.
FAQ
Published:
Mar 15, 2026 09:59 AM
Category: