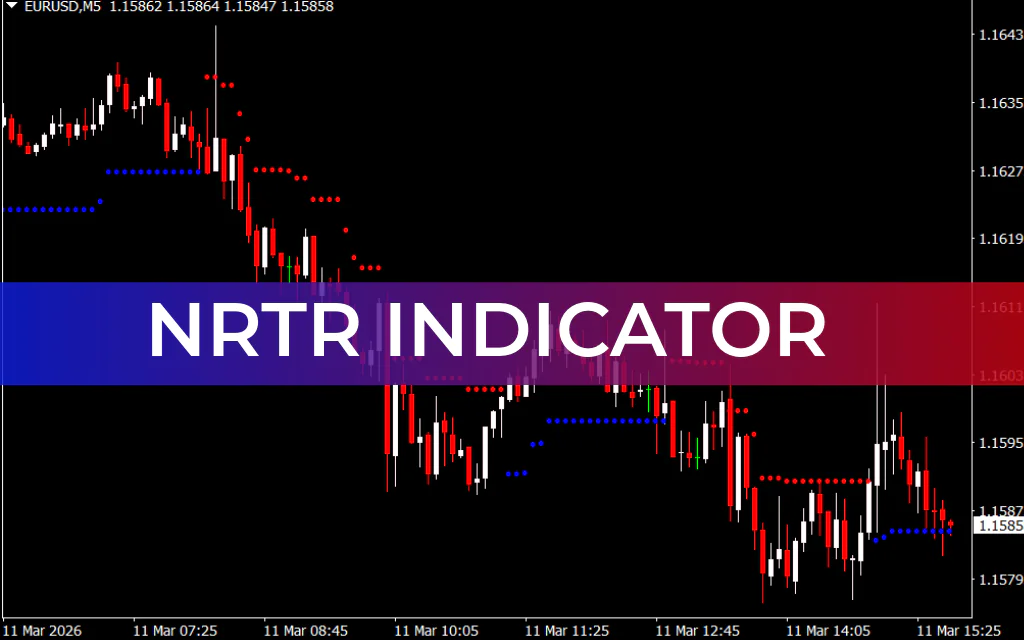
The NRTR Indicator (Nick Rypock Trailing Reverse) is a trend-following tool that helps traders identify market direction, trend reversals, and precise entry/exit points. Developed by Nick Rypock in 2001, this indicator has remained a popular choice for traders due to its simplicity and accuracy.
The NRTR works by plotting Support And Resistance lines alongside confirmation dots, providing traders with clear visual signals to make informed trading decisions.

How the NRTR Indicator Works
The NRTR Indicator plots five key lines with a period of 10, which act as dynamic support and resistance levels:
- R1, R2, R3 – Resistance lines for downward trends
- S1 – Support line for upward trends
- P1 – Neutral line where Price Action decides the next trend direction
Along with these lines, the indicator plots dots for Trend Confirmation:
- Red Dots – Indicate a downward trend
- Blue Dots – Indicate an upward trend
By combining the lines and dots, traders can easily identify trend bias, potential reversals, and high-probability entry and exit points.
The NRTR works on all timeframes, though it is most effective on longer timeframes such as Daily, Weekly, or Monthly charts.
NRTR Indicator BUY/SELL Signals
Buy Signal
To enter a long position, the following conditions should be met:
- Price is below or near the S1 support line
- Blue dots appear on the chart
When both conditions are satisfied, traders can enter long trades or exit short positions.
Sell Signal
To enter a short position, the following conditions should be met:
- Price is above or near the R3 resistance line
- Red dots appear on the chart
When both conditions are satisfied, traders can enter short trades or exit long positions.
Neutral or Waiting Period
Sometimes, the NRTR plots dots between P1 and R1. During these periods:
- Wait for price action confirmation
- Enter trades only after dots appear to avoid premature entries
This ensures higher accuracy and reduces the risk of false signals.
Improving Accuracy with Additional Indicators
While the NRTR Indicator works well on its own, traders can enhance performance by combining it with other tools such as:
- RSI (Relative Strength Index) – Confirms overbought or oversold conditions
- MACD (Moving Average Convergence Divergence) – Confirms momentum and trend direction
Conclusion
The NRTR Indicator is a reliable tool for plotting support and resistance lines and confirmation dots to determine trend direction. By following its signals, traders can identify exact entry and exit points, manage trades more efficiently, and increase their win rate.
The indicator works well on multiple timeframes and is suitable for all levels of traders. You can download the NRTR Indicator for free and add it to your trading toolkit today.
FAQ
Published:
Mar 11, 2026 10:47 AM
Category: