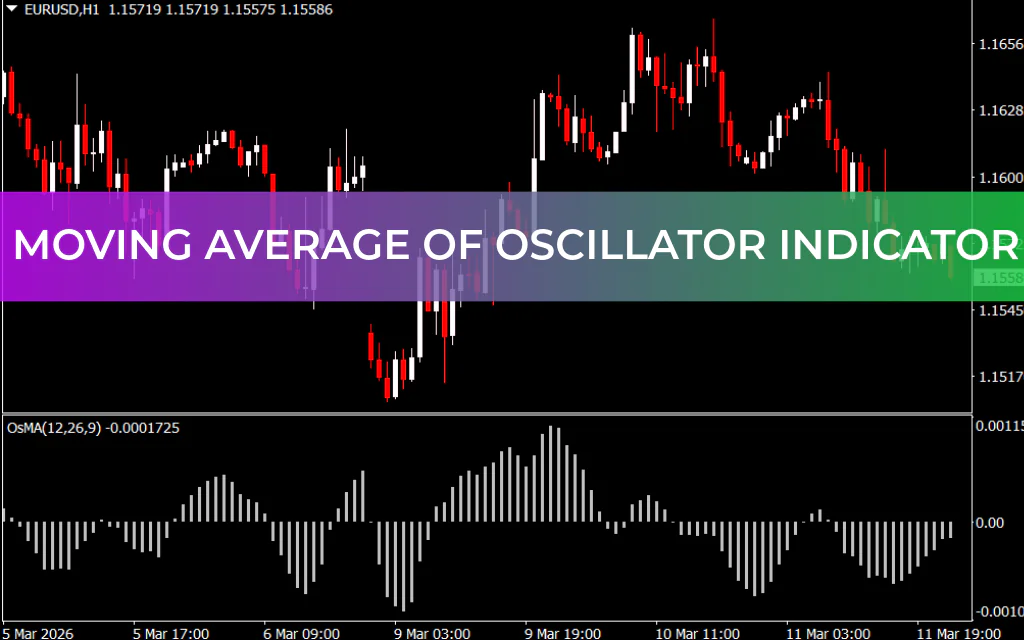
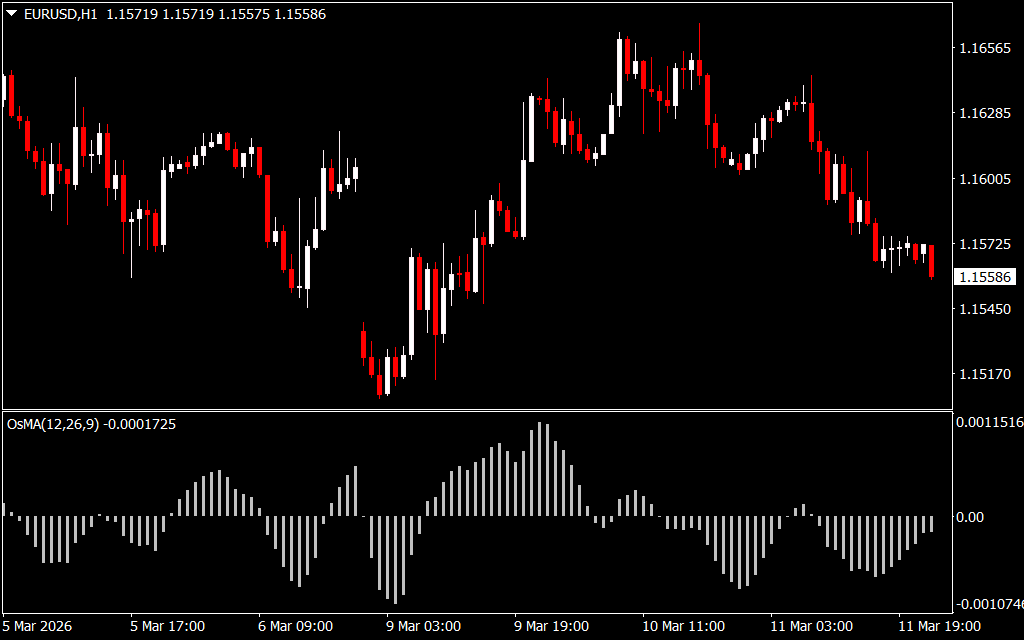
The Moving Average of Oscillator (OsMA) is a popular technical indicator used to identify overbought and oversold conditions in the market and spot potential trend reversals. It is closely related to the MACD (Moving Average Convergence Divergence) and essentially measures the difference between the MACD line and its signal line.
How OsMA Works
The OsMA forms a histogram below the price chart that visually shows market momentum and potential reversal zones.
Calculation:
OsMA=MACD−Signal Line\text{OsMA} = \text{MACD} - \text{Signal Line}OsMA=MACD−Signal Line
Where:
- MACD = 12-period EMA − 26-period EMA
- Signal Line = 9-period SMA of the MACD
The histogram bars indicate the strength of the trend:
- Above zero – bullish momentum
- Below zero – bearish momentum
How to Trade Using OsMA
1. Divergence Strategy
Divergence between Price Action and the OsMA histogram signals a potential Trend Reversal:
- Bearish Divergence: Price rises, but the OsMA histogram falls → signals a potential downward reversal.
- Bullish Divergence: Price falls, but the OsMA histogram rises → signals a potential upward reversal.
Trade Entry:
- Wait for the histogram bars to shrink and approach the zero line, confirming momentum shift.
- Enter the trade in the direction of the histogram movement.
Trade Exit:
- Close the trade when the histogram bars become smaller than the previous one, indicating weakening momentum.
- Alternatively, exit on a pullback from a recent high/low candle.
2. Overbought/Oversold Levels
OsMA can help traders spot extreme market conditions where trends are likely to reverse:
- High histogram peaks → overbought → possible sell opportunity
- Low histogram troughs → oversold → possible buy opportunity
Practical Use
- Available in MT4 under the Oscillators section
- Works on any timeframe – suitable for Scalping, intraday, and swing trading
- Best used in conjunction with other indicators like moving averages or trend lines to confirm reversals
Conclusion
The Moving Average of Oscillator (OsMA) is a simple yet powerful indicator for:
- Identifying overbought and oversold conditions
- Spotting trend reversals via divergence
- Measuring momentum shifts in the market
A divergence strategy is particularly effective, but OsMA can also be incorporated into more complex trading systems for higher accuracy. Its visual histogram makes it intuitive for traders of all experience levels.
FAQ
1 Download
Published:
Mar 11, 2026 18:35 PM
Category: