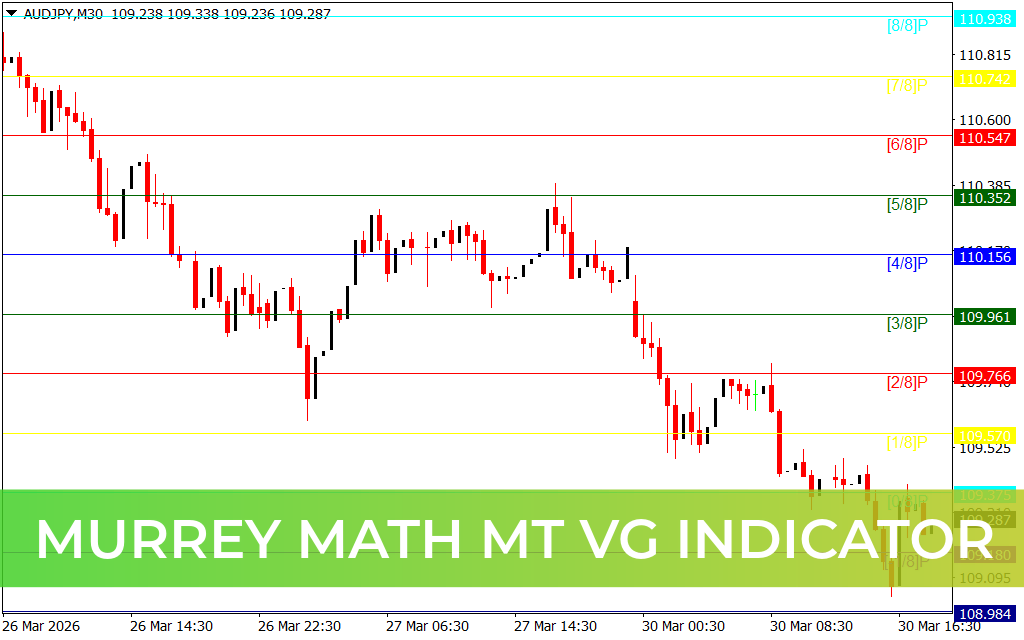
The Murrey Math MT VG Indicator for MT4 is a powerful technical analysis tool that automatically calculates and plots multiple Support And Resistance levels on your chart. It provides traders with a structured framework to analyze price movements and identify high-probability entry and exit points.
By combining mathematical price levels with visual clarity, this indicator helps traders make more informed decisions based on Market Structure and price action.
What Is the Murrey Math MT VG Indicator?
The Murrey Math MT VG Indicator is based on Murrey Math principles, which divide price into structured levels within a trading range. These levels act as key zones where price tends to react, reverse, or consolidate.
The indicator automatically plots multiple lines, each representing a different level of market strength, reversal probability, or price exhaustion.
Key Features
- Automatically calculates support and resistance levels
- Displays multiple line types for detailed analysis
- Identifies pivot reversal zones and overshoot levels
- Highlights overbought and oversold conditions
- Plots upper and lower trading range boundaries
- Suitable for all trading styles and timeframes
Understanding the Indicator Lines
The indicator uses color-coded lines to simplify analysis:
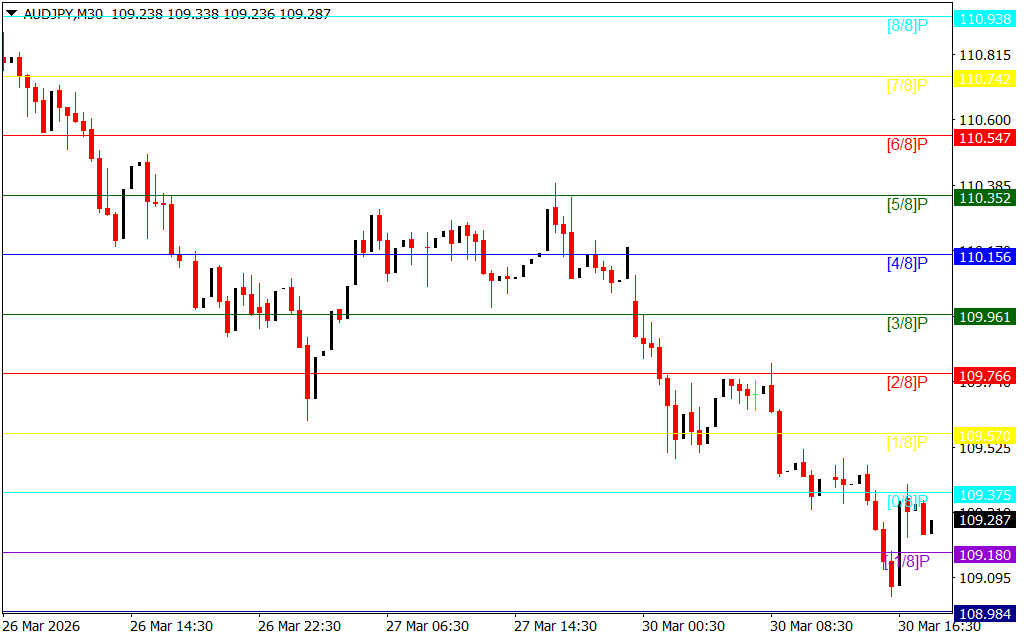
- Aqua Lines: Ultimate support and resistance (key entry zones)
- Purple Lines: Overshoot levels
- Blue Lines: Extreme overshoot levels
- Red Lines: Strong pivot reversal support and resistance
- Yellow Lines: Weak stall and reversal points
- Green Lines: Upper and lower range boundaries
These levels provide a comprehensive map of price behavior, helping traders anticipate potential reversals and breakouts.
How It Works
The indicator divides the chart into a structured range and plots key levels based on mathematical calculations. These levels act as psychological and technical zones where price is likely to react.
- Price above the central pivot indicates a bullish trend
- Price below the central pivot indicates a bearish trend
This helps traders align their positions with the prevailing market direction.
Trading Strategy Using Murrey Math MT VG
Buy Setup
- Enter a buy trade when price reaches the lower aqua support line
- Confirm the entry with bullish Price Action
- Place stop loss slightly below the previous low
- Set take profit based on a favorable risk-to-reward ratio
Sell Setup
- Enter a sell trade when price reaches the upper aqua resistance line
- Confirm the entry with bearish price action
- Place stop loss above the previous high
- Set take profit based on risk management rules
Trading Tips
- Combine with other indicators for confirmation
- Avoid trading during low volatility conditions
- Focus on key levels (Aqua and Red lines) for higher accuracy
- Always follow proper risk management strategies
Conclusion
In summary, the Murrey Math MT VG Indicator for MT4 is an advanced and versatile tool that automatically plots crucial support and resistance levels. By leveraging structured price zones and mathematical analysis, traders can improve their entry timing, manage risk effectively, and enhance overall trading performance.
1 Download
Published:
Mar 30, 2026 12:47 PM
Category: