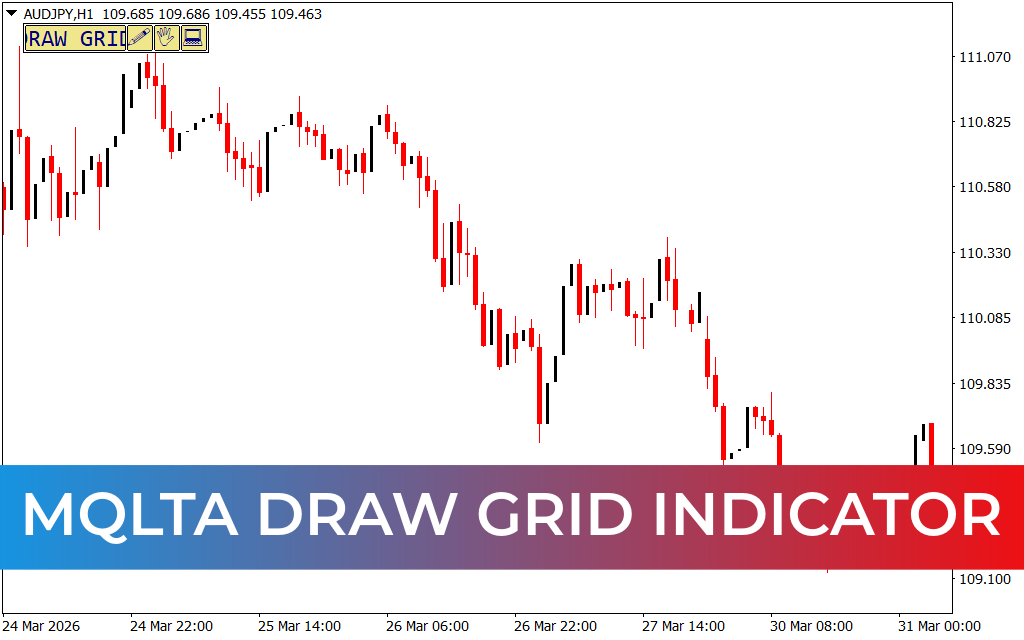
The MQLTA Draw Grid Indicator for MT4 is a simple yet effective tool that automatically plots a customizable grid on your trading chart. These grid lines act as dynamic Support And Resistance levels, helping traders identify key price zones with ease.
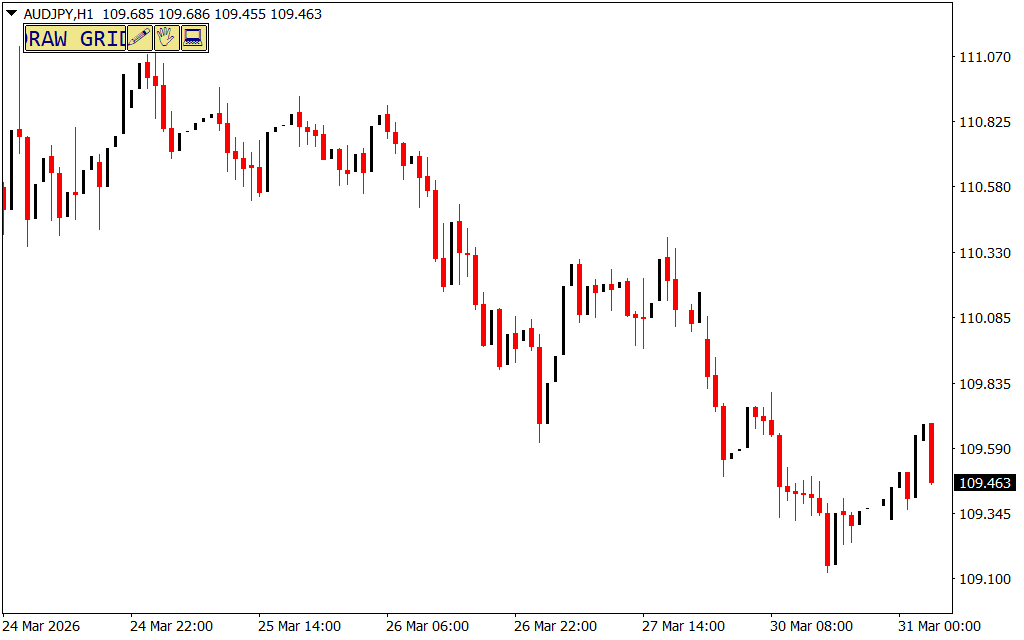
Upon applying the indicator, traders can manually activate the grid by selecting the desired drawing options. Once enabled, the grid provides a structured view of price movement, making it easier to analyze market behavior.
Additionally, the indicator features an options panel that displays important data such as the starting price, high and low range, and grid leg details. While it works on all timeframes, it performs best on higher timeframes like H1 and above.
How the MQLTA Draw Grid Indicator Works
The indicator divides the chart into multiple levels using grid lines, which traders can use to interpret Price Action.
- Grid lines act as support and resistance zones
- Help visualize price structure and breakout areas
- Provide a clear framework for decision-making
This makes it especially useful for traders who prefer structured and rule-based strategies.
MQLTA Draw Grid Indicator BUY/SELL Signals
The indicator generates trading signals based on price interaction with the grid levels:
- Sell Signal: When the price breaks above the upper grid level
- Buy Signal: When the price drops below the lower grid level
- No Trade Zone: When price moves within the middle grid levels (indicates market indecision)
Traders should avoid entering trades during consolidation phases and wait for clear breakouts.
For better accuracy, it is highly recommended to combine this indicator with other technical tools to confirm trend direction.
Best Strategy for Using the Indicator
To maximize results, traders can combine the MQLTA Draw Grid Indicator with:
- Trend indicators (e.g., Moving Averages)
- Momentum indicators (e.g., RSI, MACD)
- Breakout strategies for volatile markets
This combination helps filter false signals and improves overall trade quality.
Conclusion
The MQLTA Draw Grid Indicator for MT4 is a practical tool for identifying key price levels and understanding Market Structure. By using grid-based support and resistance zones, traders can make more precise entry and exit decisions.
Whether you are trading breakouts or reversals, this indicator provides a clear and structured approach to analyzing price action.
1 Download
Published:
Mar 30, 2026 22:50 PM
Category: