The Market Facilitation Index (MFI) is a technical indicator created by Bill Williams and introduced in his well-known book Trading Chaos. It was designed to measure how efficiently price moves in relation to trading volume and to identify the strength or weakness of a market trend.
Bill Williams considered the MFI one of the most powerful tools for understanding how the market reacts to changes in trading volume. Although Williams often emphasized that his trading approach was unique and different from traditional technical analysis, many of his indicators—such as the Alligator Indicator, Awesome Oscillator, and Accelerator Oscillator—are based on modified moving averages and oscillators commonly used in technical trading.
Market Facilitation Index Indicator Formula
The Market Facilitation Index is calculated using a simple formula:
MFI = (High – Low) / Volume
Where:
- High – The highest price of the current candle
- Low – The lowest price of the current candle
- Volume – The tick trading volume for that candle
This formula measures how much the price moves relative to the trading volume during a specific period.
How the Market Facilitation Index Works
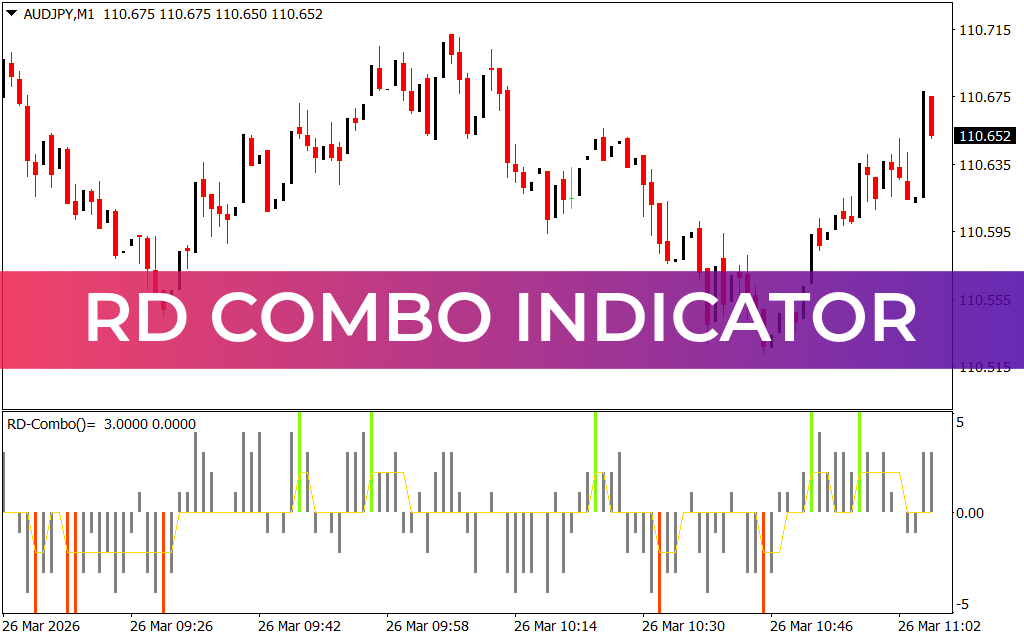
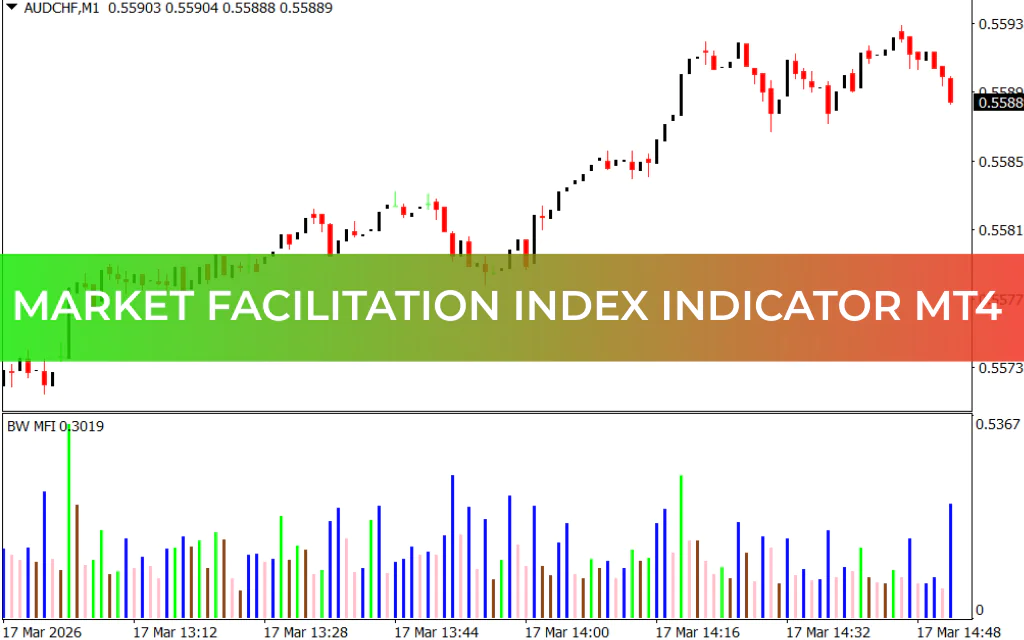
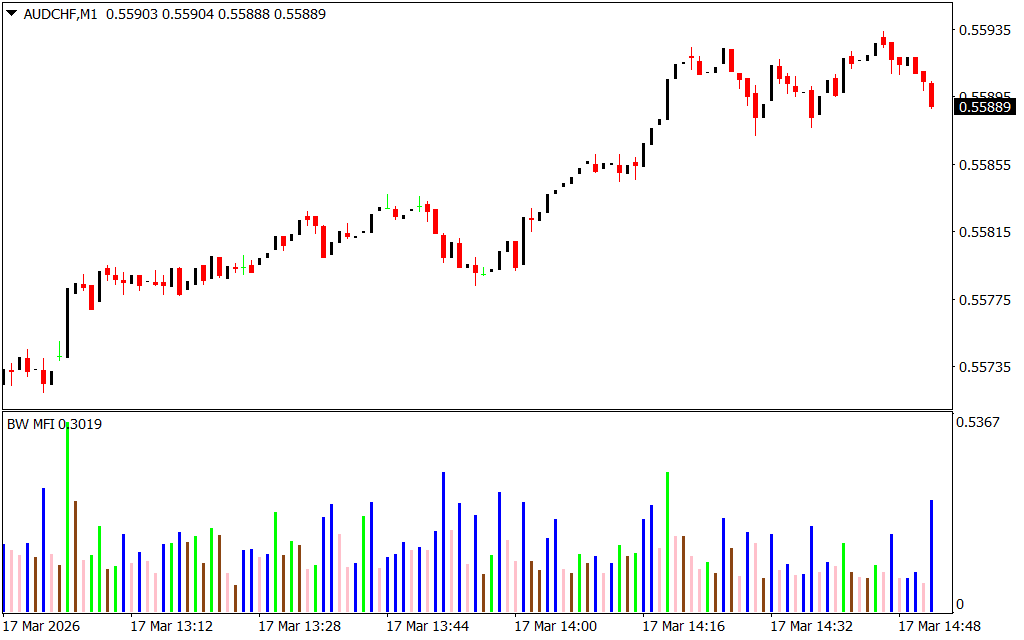
The MFI indicator appears as a histogram with different colored bars, and each color represents a specific market condition.
1. Green Bar – Strong Trend Continuation
A green bar indicates that both price and trading volume are increasing. This suggests that more traders are entering the market and supporting the current trend.
- The trend is gaining strength.
- Existing positions are confirmed.
- It is usually not the best time to open a new trade, as the move may already be extended.
2. Brown Bar – Weakening Market Interest
A brown bar appears when price movement decreases while volume increases. This indicates that traders are becoming less interested in the asset.
- Momentum is fading.
- A sideways market may follow.
- Entering trades against the previous trend is risky because a new trend may not form immediately.
3. Blue Bar – Market Uncertainty
A blue bar forms when price movement increases but trading volume decreases.
This means:
- The price is moving with low market participation.
- The current trend lacks strong support.
- The market could stall or reverse at any moment.
Traders usually consider this a sign of uncertainty.
4. Pink Bar – Possible Trend Reversal
The pink bar is the most important signal in the MFI indicator.
It occurs when both price movement and volume increase sharply, showing strong activity from both buyers and sellers.
This situation often indicates:
- A potential Trend Reversal
- Increasing market volatility
- Strong participation from market players
Many traders watch the pink bar closely because it frequently precedes major market turning points.
Market Facilitation Index Trading Strategy
Below are two simple trading setups using the MFI indicator.
Buy Setup (Bullish Strategy)
A buy trade can be considered when the following conditions appear:
- A pink bar forms on the MFI histogram.
- Place a Buy Stop order a few pips above the last local high.
- Set the Stop Loss below the last local low.
- Place the Take Profit at 2–3 times the stop-loss distance, depending on Market Structure and nearby support or resistance levels.
This approach allows traders to catch a potential upward reversal with controlled risk.
Sell Setup (Bearish Strategy)
A sell trade setup includes these steps:
- A pink bar appears on the MFI indicator.
- Place a Sell Stop order a few pips below the last local low.
- Set the Stop Loss above the last local high.
- Use a Take Profit target 2–3 times larger than the stop loss, depending on market conditions.
This strategy attempts to capture a new downward trend after a potential reversal signal.
Conclusion
The Market Facilitation Index indicator developed by Bill Williams is a powerful tool for analyzing Trend Strength and potential market reversals. The indicator uses a color-coded histogram to show how price movement interacts with trading volume.
Among all signals, the pink bar is the most important, as it often highlights strong market participation and signals a possible trend reversal. When combined with other technical indicators and proper risk management, the MFI can become a valuable part of any trading strategy.
FAQ
2 Downloads
Published:
Mar 17, 2026 09:54 AM
Category: