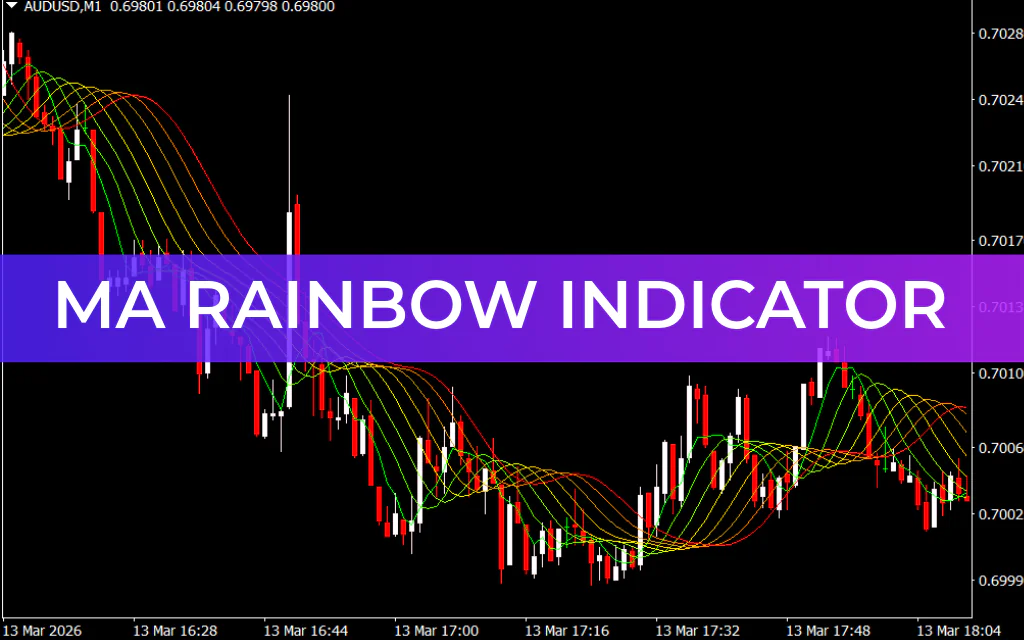
he MA Rainbow Indicator for MT4 is a powerful trend-following tool made up of multiple moving averages arranged in a rainbow-like structure. This visual layout helps traders quickly identify bullish and bearish trends, detect trend reversals, and find reliable buy and sell opportunities in the forex market.
Because the indicator uses several moving averages with different speeds, it clearly shows Trend Strength, direction, and potential support or resistance zones. The MA Rainbow indicator is widely used by both beginner and professional traders for identifying strong market trends and improving trade timing.
How the MA Rainbow Indicator Works
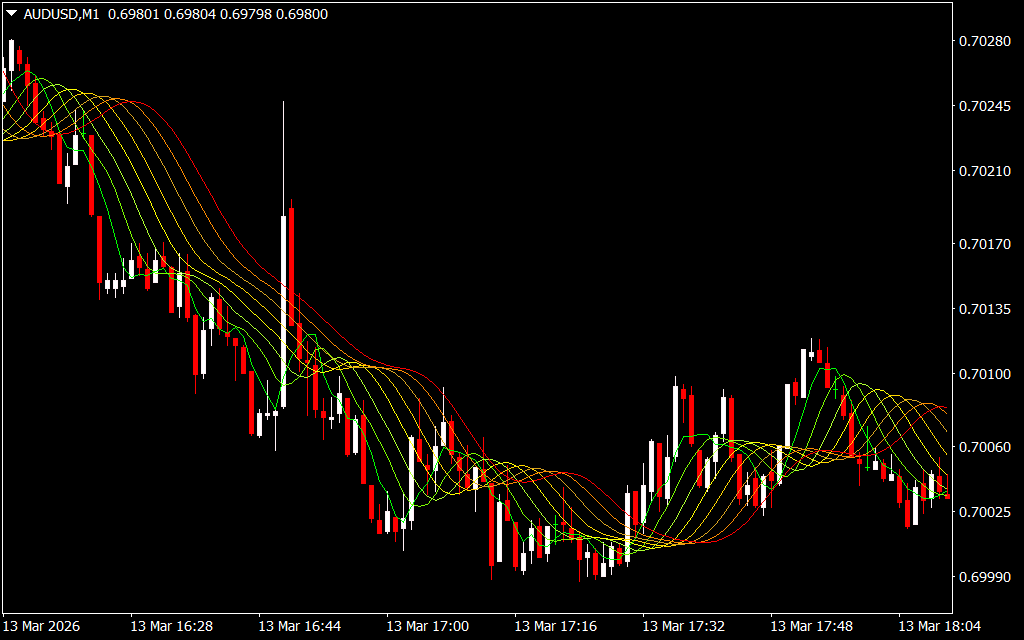
The MA Rainbow indicator displays multiple moving averages stacked together, forming a rainbow pattern on the chart. These moving averages react differently to price movement, allowing traders to observe how the trend develops over time.
Typically the indicator displays:
Bullish Moving Averages
- Lime
- Lawn Green
- Green Yellow
- Yellow
Bearish Moving Averages
- Red
- Dark Orange
- Golden Rod
- Gold
The outer moving averages are used mainly for entry and exit signals, while the inner moving averages help traders evaluate trend strength and direction.
The moving averages collectively act as dynamic Support And Resistance levels, making them useful for both trend-following and reversal trading.
MA Rainbow Indicator Trading Signals
Bullish Signal (Buy Setup)
A bullish trend signal occurs when:
- The price closes above the upper green moving average of the rainbow.
- The moving averages start spreading upward, confirming bullish momentum.
Trading approach:
- Enter a BUY trade after the bullish breakout.
- Place the stop-loss below the previous swing low.
- Exit when an opposite bearish signal appears.
This strategy allows trend traders to ride the trend for extended moves.
Bearish Signal (Sell Setup)
A bearish signal appears when:
- The price closes below the lower red moving average of the rainbow.
- The moving averages begin spreading downward, confirming bearish momentum.
Trading approach:
- Enter a SELL trade after the bearish breakout.
- Place the stop-loss above the previous swing high.
- Exit the trade when a bullish signal forms.
Multi-Timeframe Trading with MA Rainbow
One of the biggest advantages of the MA Rainbow indicator is its suitability for multi-timeframe (MTF) analysis.
Traders often use this approach:
- Identify the main trend on higher timeframes such as Daily or H4.
- Use lower timeframes like H1 or M15 to find precise entry points.
Since trends on higher timeframes usually last longer, this strategy improves trade accuracy and reduces false signals.
Advantages of the MA Rainbow Indicator
Pros
- Clearly identifies bullish and bearish trends
- Shows trend strength through moving average expansion
- Provides dynamic support and resistance levels
- Works on all timeframes
- Suitable for both beginners and advanced traders
Cons
- Like all moving averages, signals may lag during fast markets
- Works best when combined with other indicators or Price Action analysis
Conclusion
The MA Rainbow Indicator for MT4 is an effective tool for trend-following trading strategies. By combining multiple moving averages into a colorful structure, it allows traders to quickly identify market direction, trend strength, and potential entry points.
Beginner traders can use it to visually understand market trends, while advanced traders can integrate it into multi-timeframe and complex trading strategies.
Best of all, the MA Rainbow indicator is free to download and easy to install on MetaTrader 4, making it a valuable addition to any trader’s toolkit.
FAQ
1 Download
Published:
Mar 15, 2026 18:15 PM
Category: