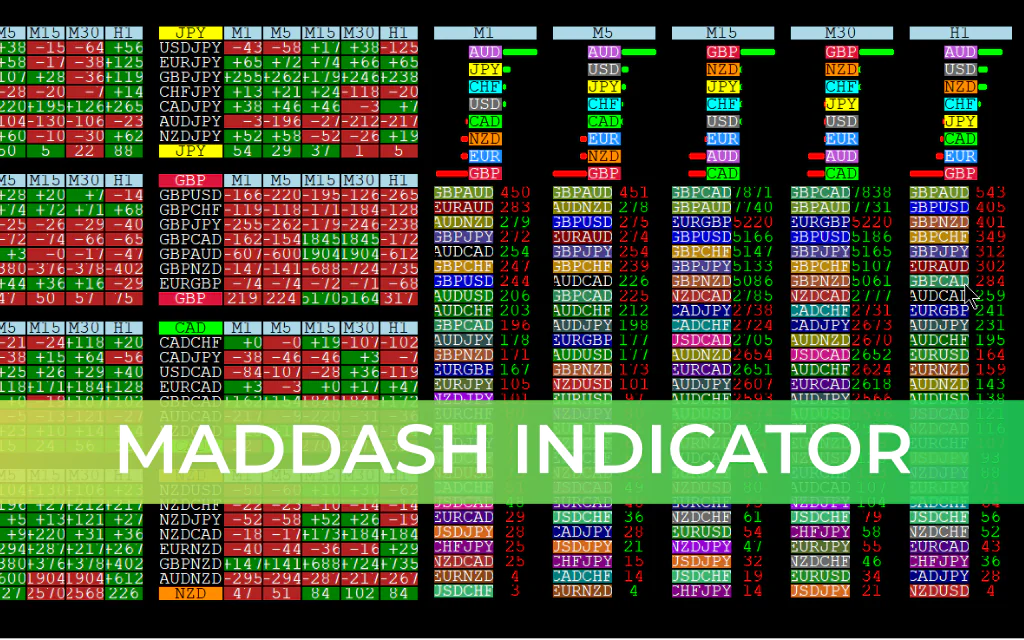
The MADdash (Moving Average Distance Dashboard) for MetaTrader 4 is a multi-currency, multi-timeframe tool designed to provide a holistic overview of market strength and momentum. Unlike single-chart indicators, MADdash scans multiple currency pairs simultaneously and visualizes their relative strength using moving averages, making it ideal for trend identification, currency strength analysis, and trade opportunity scanning.
How It Works
Moving Average Distance:
Computes the distance between price and smoothed moving averages across several timeframes for each currency pair.
Positive values indicate bullish momentum; negative values indicate bearish momentum.
Dashboard Visualization:
Displays results as a color-coded heatmap.
Green values → strong bullish trend
Red values → strong bearish trend
Currency pairs are ranked to quickly identify strongest and weakest currencies.
Multi-Timeframe Analysis:
Aggregates signals from multiple timeframes to highlight consistent trends.
Helps traders distinguish between short-term noise and higher-confidence setups.
Trading Applications
Trend Continuation: Enter trades in the direction of currencies showing consistent strength across timeframes.
Reversal Detection: Identify weak currencies for potential counter-trend setups.
Currency Strength/Weakness Pairs: Combine strongest and weakest currencies for high-probability pair trades.
Correlation Awareness: Recognize market-wide moves and avoid redundant positions.
Benefits
✔ Multi-currency, multi-timeframe analysis at a glance
✔ Heatmap visualization simplifies trend spotting
✔ Highlights strong bullish or bearish candidates for trades
✔ Customizable settings for preferred moving averages and timeframes
✔ Supports faster and more informed decision-making in forex trading
FAQ
5 Downloads
Published:
Feb 21, 2026 04:36 AM
Category: