he MACD on Chart Indicator is an advanced MT4 tool that integrates trend and momentum analysis directly onto the main chart. Unlike traditional MACD indicators that display signals in a separate window, this indicator allows traders to monitor momentum and trend conditions without leaving the price chart, enhancing real-time decision-making.
It combines fast and slow EMA crossovers with a 200-period MACD line to generate precise buy and sell signals for forex, stocks, and other trading instruments.

Key Features of MACD on Chart
- Trend visualization on the main chart – No need to check a separate window.
- EMA crossovers – Seven fast and slow EMAs track short- and long-term trends.
- 200-period MACD line – Identifies overall market momentum.
- Multi-timeframe support (MTF) – Works consistently on all MT4 chart timeframes.
- Buy/Sell signal confirmation – Combines momentum and EMA crossovers for higher accuracy.
How the MACD on Chart Indicator Works
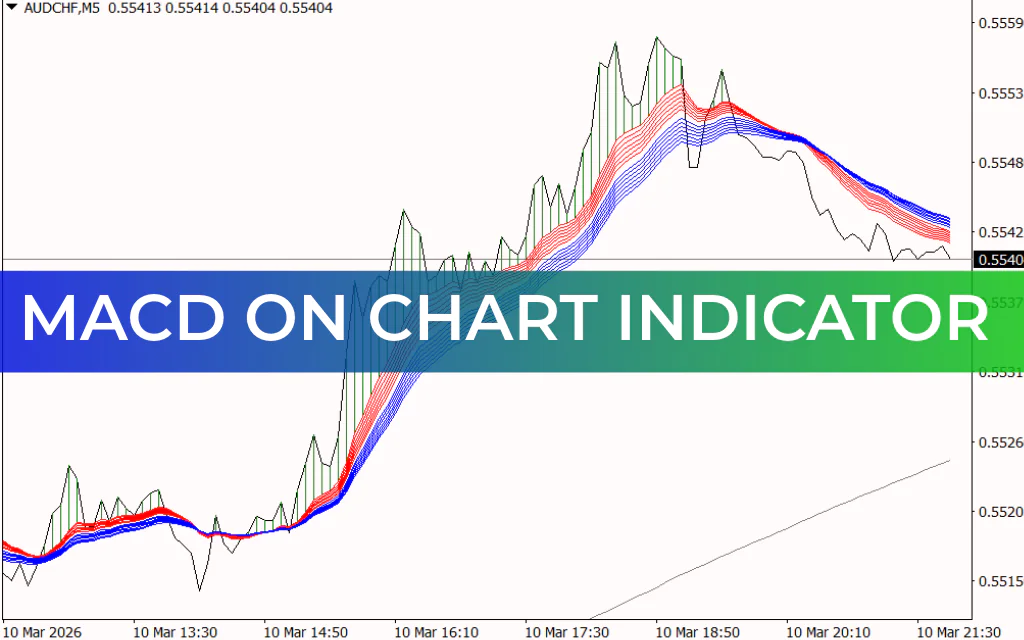
The indicator consists of three main elements:
- Fast EMA (red curvilinear lines)
- Tracks short-term price movements.
- Slow EMA (blue curvilinear lines)
- Tracks longer-term price trends.
- MACD Line (gray horizontal line)
- Represents the overall market momentum.
- Price above MACD → bullish momentum.
- Price below MACD → bearish momentum.
How to Trade with MACD on Chart
Buy Signal (Long Trade)
- Confirm bullish momentum: Price should be above the MACD line.
- EMA crossover: Fast EMA (red) crosses above slow EMA (blue).
- Optional confirmation: Combine with Price Action signals like bullish engulfing or support rejection.
- Enter long position and place exit near EMA support or when momentum shifts.
Sell Signal (Short Trade)
- Confirm bearish momentum: Price should be below the MACD line.
- EMA crossover: Fast EMA (red) crosses below slow EMA (blue).
- Optional confirmation: Combine with price action like bearish pin bars or resistance rejection.
- Enter short position and exit near EMA resistance or when momentum shifts.
Advantages of MACD on Chart
- Real-time momentum assessment without switching windows.
- Multiple confirmation layers – EMA crossover + MACD line.
- Suitable for all MT4 traders – from beginners to advanced.
- Works across different market instruments – forex, stocks, indices.
- Improves trade accuracy – reduces weak or false trades.
Conclusion
The MACD on Chart Indicator is a versatile MT4 tool that combines trend-following and momentum analysis directly on the chart. By using EMA crossovers along with the MACD line, traders can identify high-probability buy and sell setups. This makes it suitable for Scalping, intraday, and swing trading across multiple instruments.
It is a free MT4 indicator that enhances market analysis and helps traders make more confident trading decisions.
FAQ
3 Downloads
Published:
Mar 10, 2026 16:53 PM
Category: