The Linear Price Bar Indicator for MT4 is a simple yet effective technical tool used to identify the overall market trend. It displays bullish and bearish bars around a central zero line, allowing traders to quickly determine whether the market is moving upward or downward.
This indicator works directly within the MetaTrader 4 platform and is suitable for traders who want a clear visual representation of trend direction without cluttering their charts.
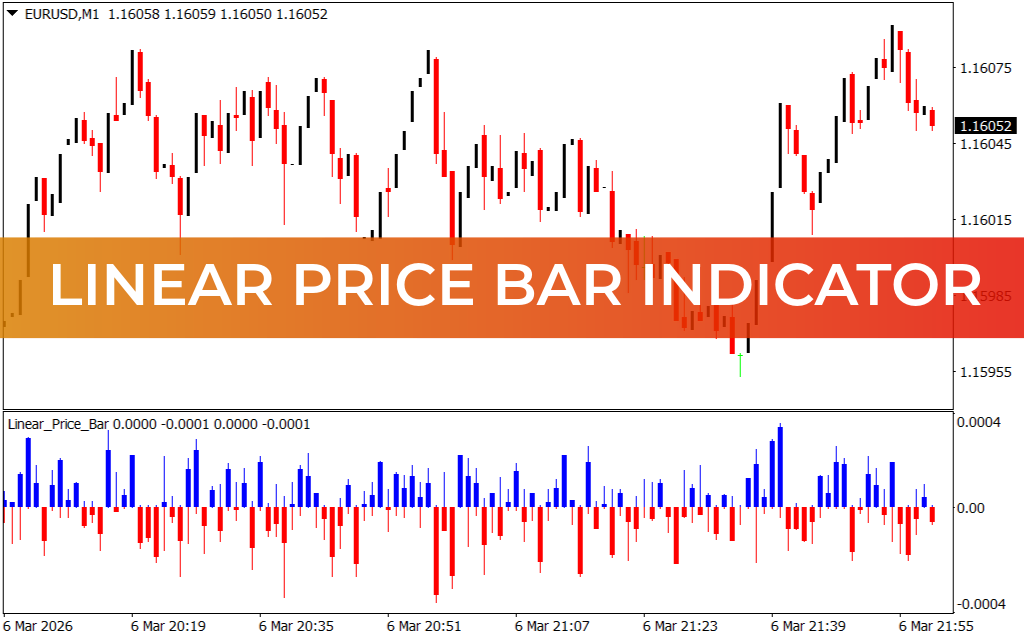
The Linear Price Bar Indicator contains two main components:
- A zero line (center line)
- Bullish and bearish bars
Together, these elements help traders interpret trend direction, continuation, and potential reversal signals.
How the Linear Price Bar Indicator Works
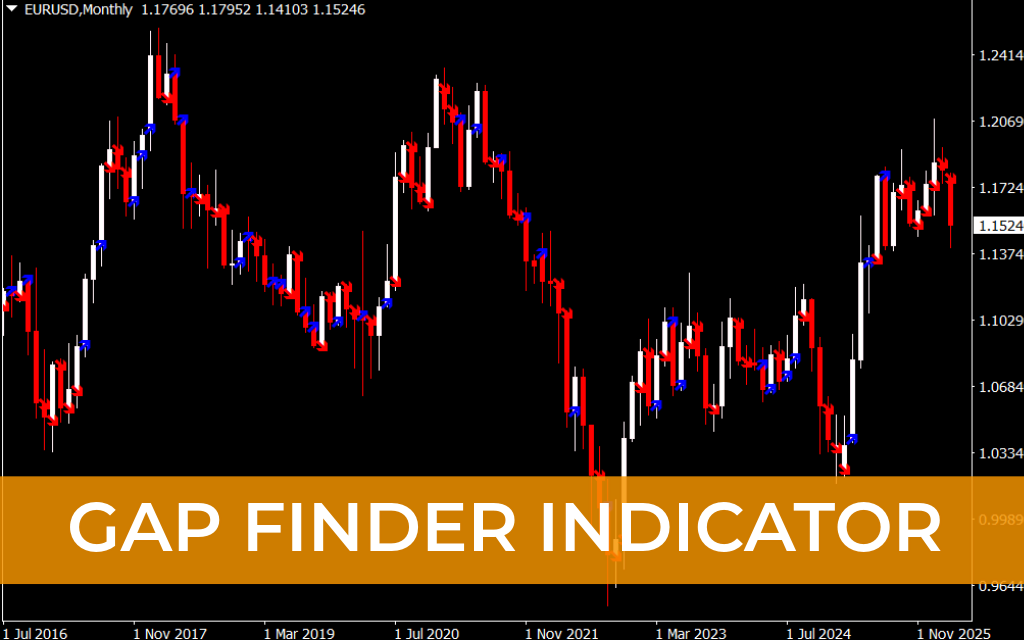
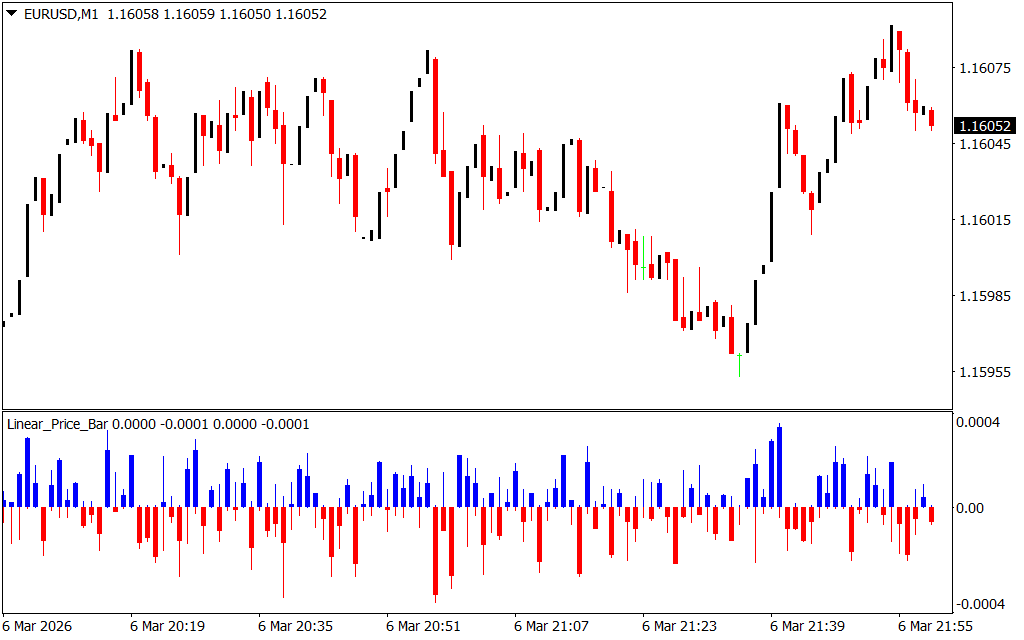
The indicator plots colored bars that move above or below the zero line, reflecting the direction of price momentum.
Bullish Bars (Blue)
- Appear above the zero line
- Indicate bullish market momentum
- Suggest potential buy opportunities
Bearish Bars (Red)
- Appear below the zero line
- Indicate bearish market momentum
- Suggest potential sell opportunities
Because the bars follow Price Action closely, they provide traders with a quick visual confirmation of the current trend.
Example Trading Setup
Consider an example using the **USD/JPY currency pair on the H4 timeframe.
- The indicator shows blue bars forming above the zero line.
- This indicates strong bullish momentum.
- Traders can look for buy opportunities during pullbacks or support retests.
Conversely:
- Red bars appear below the zero line.
- This confirms bearish momentum.
- Traders can consider sell entries when price reacts near resistance.
Important Trading Tip
Since the bars follow price movements closely, the indicator may show temporary opposite-colored bars during pullbacks.
For example:
- Blue bars may appear briefly during a downtrend retracement.
- Red bars may appear during a bullish pullback.
Because of this, traders should wait for confirmation before entering trades and combine the indicator with other tools.
Best Timeframes to Use
The Linear Price Bar Indicator can be used on all timeframes, but it generally performs better on higher timeframes, such as:
- H1
- H4
- Daily
Higher timeframes help traders get a broader view of the overall market trend.
Recommended Confirmation Tools
To improve signal accuracy, combine the indicator with:
- Support And Resistance levels
- Price action patterns
- Moving averages
- Trendline analysis
These confirmations help traders avoid false signals and identify stronger setups.
Key Features of the Linear Price Bar Indicator
- Clear bullish and bearish bar signals
- Simple zero-line trend identification
- Works on all MT4 timeframes
- Helps identify trend continuation and reversals
- Beginner-friendly visual Trend Indicator
- Suitable for Scalping, day trading, and swing trading
Who Should Use This Indicator?
The Linear Price Bar Indicator is ideal for traders who want a simple trend analysis tool.
It is commonly used by:
- Beginner traders learning trend analysis
- Day traders monitoring short-term market momentum
- Swing traders identifying larger trend movements
Because of its simplicity, it helps traders quickly understand market direction without complex calculations.
Conclusion
The Linear Price Bar Indicator for MT4 is a simple trend-following tool that uses bullish and bearish bars around a zero line to display market direction. By analyzing these bars, traders can identify trend continuation, pullbacks, and possible reversal opportunities.
When combined with price action and other technical indicators, it can become a valuable addition to any trading strategy.
FAQ
1 Download
Published:
Mar 06, 2026 16:09 PM
Category: