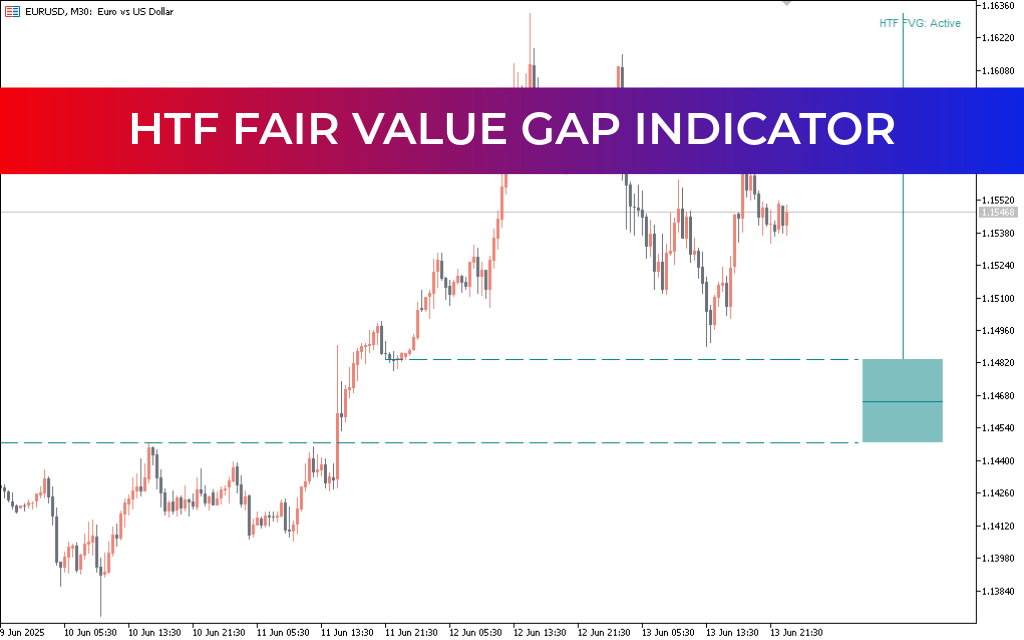
The HTF Fair Value Gap Indicator for MetaTrader 5, developed by LuxAlgo, is an advanced analytical tool designed to help traders detect institutional price imbalances formed on higher timeframes. These inefficiencies — known as Fair Value Gaps (FVGs) — highlight areas where price may later return to rebalance Supply And Demand.
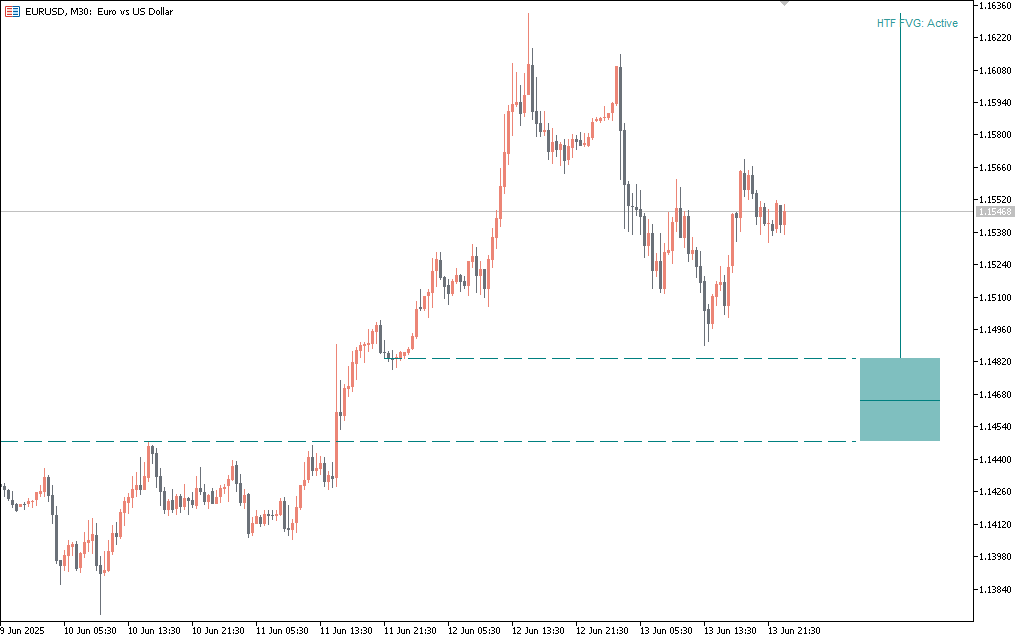
By projecting higher timeframe gaps directly onto lower timeframe charts, traders gain deeper insight into liquidity zones, mitigation levels, and potential areas of institutional activity. This added context helps refine entries, exits, and overall Market Structure analysis.
Whether trading on M5 or H1, viewing HTF imbalances alongside current Price Action can significantly improve timing and decision-making — especially for traders using smart money concepts or supply-and-demand strategies.
HTF Fair Value Gap Trading Signals
The HTF Fair Value Gap Indicator does not generate traditional buy or sell signals. Instead, it highlights high-probability reaction zones where institutional order flow may influence price behavior.
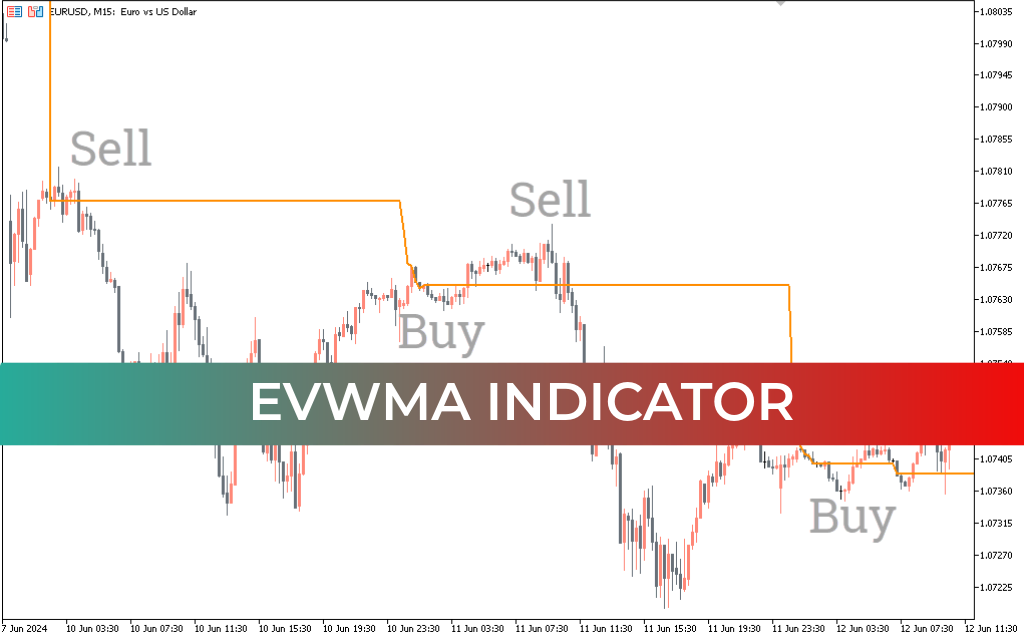
- Bullish FVG zones indicate prior upward imbalance that may act as support if price revisits the area.
- Bearish FVG zones signal overhead inefficiencies that can function as resistance during retracements.
When price interacts with these zones:
- Respect and reversal may confirm mitigation and trend continuation.
- Break and close beyond the zone can signal structural change or shifting liquidity conditions.
These institutional levels are especially valuable for identifying:
- Precision entry zones for reversion setups
- Strategic take-profit targets in trending markets
- Liquidity pools for sweep or stop-hunt scenarios
When combined with order blocks, smart money concepts, or internal structure analysis, HTF FVG zones become powerful decision-making references.
Conclusion
The HTF Fair Value Gap Indicator for MT5 provides a clean, automated method for identifying higher timeframe inefficiencies across all market conditions. Instead of manually scanning charts, traders can instantly view key institutional zones layered onto their active timeframe.
For those seeking deeper market structure insight and more precise price action execution, this indicator offers a practical edge. Whether trading supply-demand dynamics or institutional liquidity patterns, it helps align trades with areas where meaningful market activity is most likely to occur.
FAQ
9 Downloads
Published:
Feb 28, 2026 09:18 AM
Category: