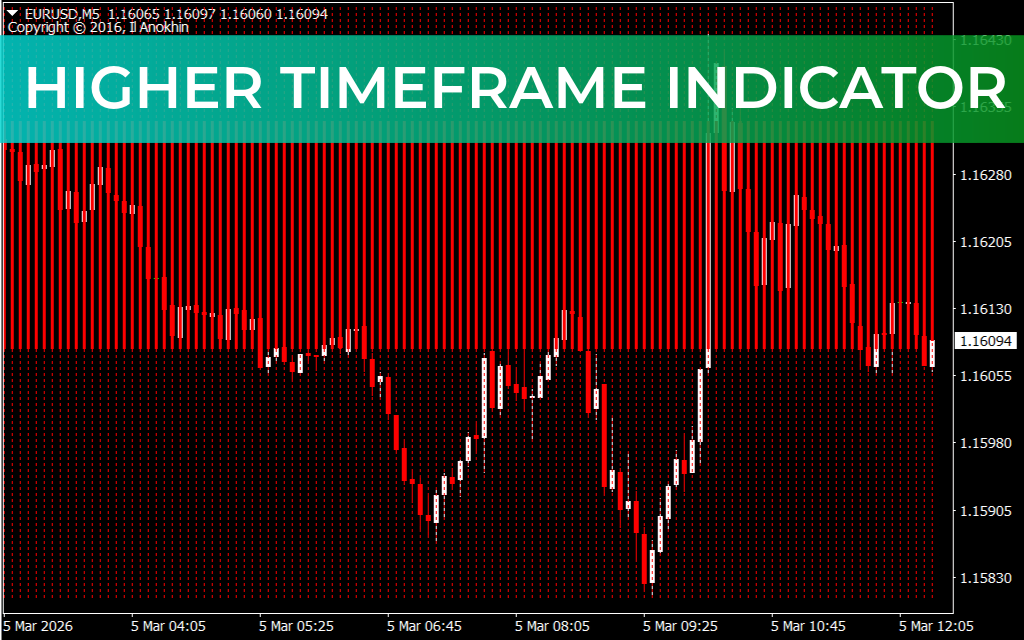
The Higher Timeframe Indicator for MetaTrader 4 is a powerful forex trading tool that helps traders monitor Market Structure on higher timeframes. By keeping track of longer-term trends, this indicator simplifies technical analysis and enhances trading decisions.
Trading in alignment with higher timeframes is widely recognized as a highly profitable approach, particularly for day, intraday, and swing traders. The indicator eliminates the stress of constantly switching between charts to check the market trend before entering a trade.
Why Higher Timeframes Are Better
- Big Picture Trends: Higher timeframes reveal the overall trend direction, while lower timeframes typically follow that trend.
- Trend Confirmation: For instance, if the daily timeframe is bullish, a long-term buy setup is more likely to succeed than a sell setup.
- Reduced Noise: Higher timeframes filter out short-term volatility and false signals seen on smaller charts.
How to Use the Higher Timeframe Indicator
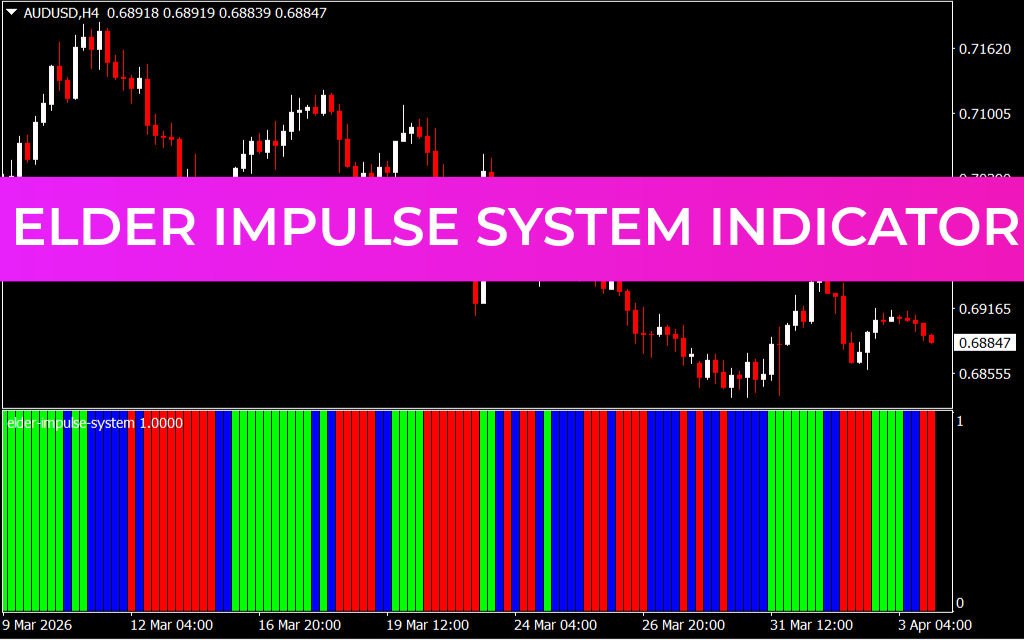
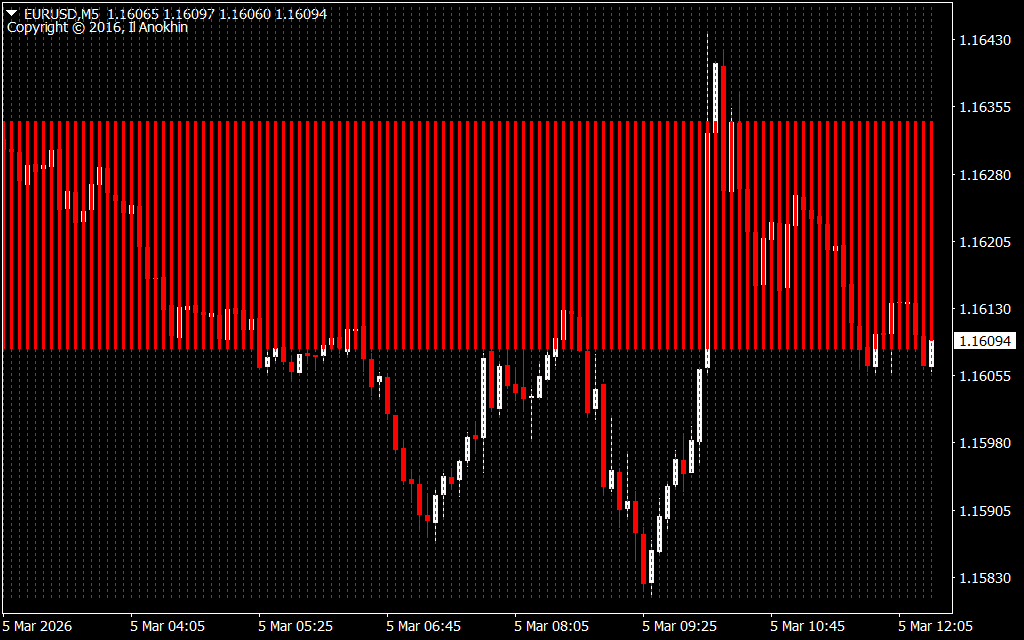
- The indicator displays trend bias using colored bars: lime-green bars indicate a bullish trend, while red bars indicate a bearish trend.
- Dotted lines show the highs and lows of the higher timeframe candlestick.
- By default, the indicator shows the daily (D1) candlestick trend, but you can adjust it to any timeframe (e.g., H4) through the settings tab.
Trading Tip: Enter trades in the direction of the higher timeframe trend and use lower timeframes for precise entries.
Benefits of the Higher Timeframe Indicator
- Helps traders align trades with the dominant trend.
- Ideal for day, intraday, and swing trading strategies.
- Customizable to any higher timeframe of interest.
- Filters out market noise for better decision-making.
- Free to download and easy to use for both new and experienced traders.
Conclusion
The Higher Timeframe Indicator for MT4 is a must-have tool for traders who want to stay aligned with the overall market trend. By displaying the trend bias of higher timeframes, it helps traders make informed trading decisions and trade with confidence.
Download: Available for free on our website.
FAQ
1 Download
Published:
Mar 05, 2026 06:28 AM
Category: