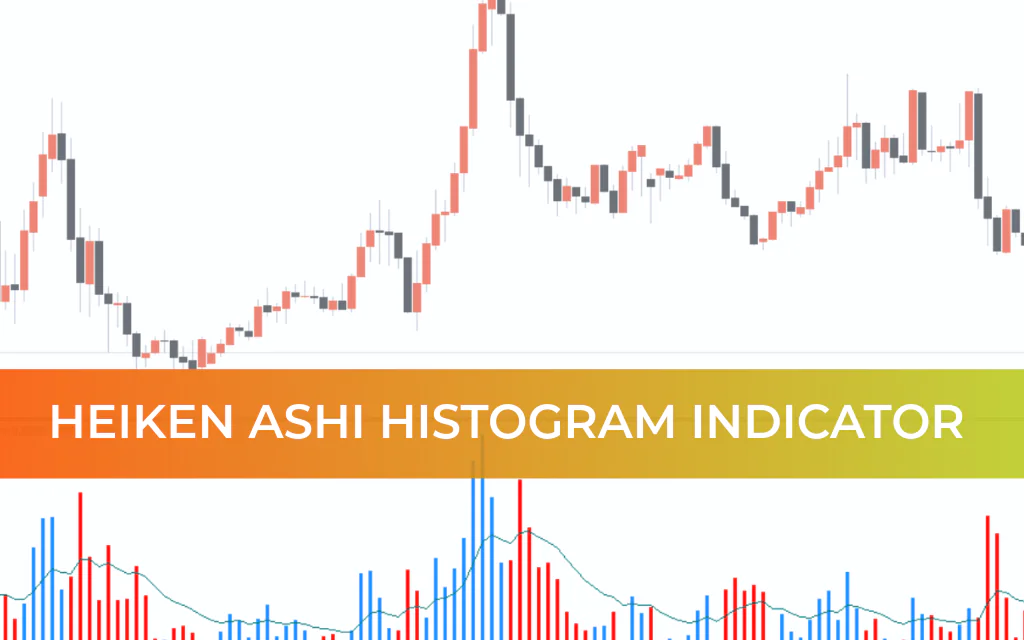
The Heiken Ashi Histogram indicator for MT4 is a variation of the traditional Heiken Ashi Oscillator. It combines histograms and moving averages to help traders quickly identify Trend Strength, potential reversals, and strong entry points.
The term “Heiken Ashi” is Japanese, meaning “average bar”, reflecting the indicator’s ability to smooth out Price Action and reduce market noise.
Why Use the Heiken Ashi Histogram Indicator?
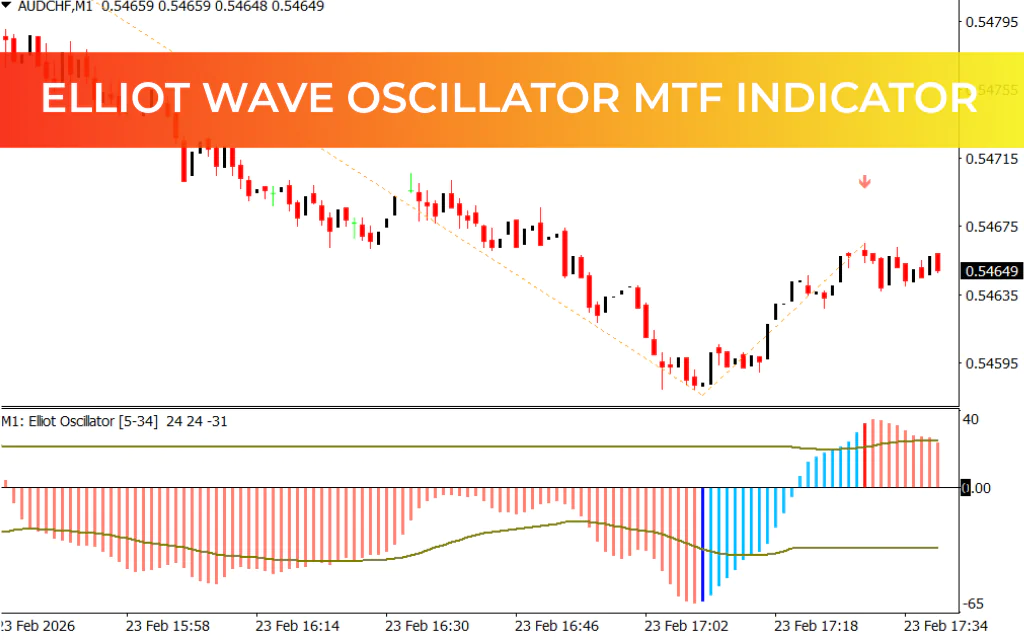
Unlike ordinary Japanese candlesticks, the Heiken Ashi Histogram simplifies trend analysis by using colored bars:
Blue bars → indicate bullish momentum
Red bars → indicate bearish momentum
Prolonged sequences of the same color signal a stronger, more reliable trend than just two or three bars.
The moving average line in the indicator helps identify the overall trend and filter out range-bound or sideways market noise, ensuring traders only act on strong trends.
Key Advantages:
Works on any timeframe (from 1-minute to weekly charts)
Suitable for any currency pair
Applicable for swing trading, day trading, and Scalping
Helps identify strong trends quickly
Provides clear visual trading signals when the histogram bars cross the moving average
How to Trade Using the Heiken Ashi Histogram Indicator
The trading signal comes from a combination of histogram color changes and bar crossover over the moving average.
Step 1: Identify Bar Colors
Blue bar → potential uptrend
Red bar → potential downtrend
Note: The bar color alone does not guarantee an entry. You must confirm with the moving average.
Step 2: Confirm with the Moving Average
Buy Setup: Wait for the blue bars to cross above the moving average. The further they rise above it, the stronger the uptrend.
Sell Setup: Wait for the red bars to cross below the moving average. The further they fall below it, the stronger the downtrend.
Example Trade
On a GBP/CHF chart:
The red arrow indicates where red bars crossed below the moving average, signaling the start of a strong downtrend. Price fell ~100 pips.
The blue arrow shows where blue bars crossed above the moving average, signaling a strong uptrend. Price rose ~50 pips.
Final Word
The Heiken Ashi Histogram indicator is an intuitive and versatile tool that helps traders anticipate trend strength and momentum.
Use it to identify strong trend continuations
Combine it with other indicators and technical analysis tools for confirmation
It’s simple, straightforward, and an essential addition to any trader’s toolkit
FAQ
5 Downloads
Published:
Feb 20, 2026 01:38 AM
Category: