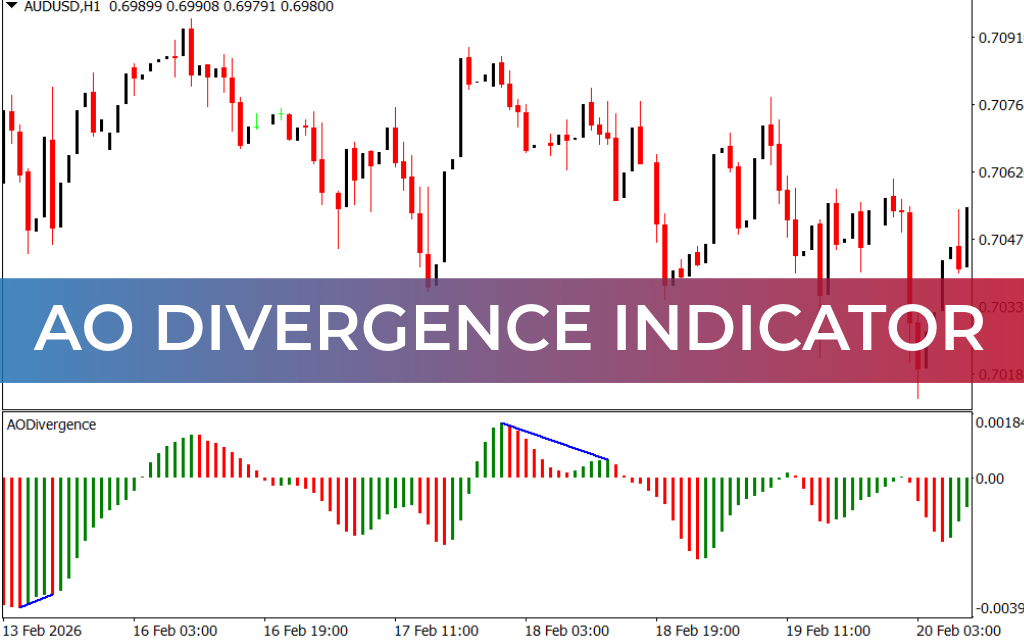
aodivergenceThe AO Divergence Indicator (Awesome Oscillator Divergence) is an enhanced version of the traditional Awesome Oscillator, designed to automatically detect divergences and provide precise BUY and SELL signals. It is ideal for trend-following and reversal trading strategies.
How the AO Divergence Indicator Works
- The indicator is calculated using the difference between two Simple Moving Averages (SMA).
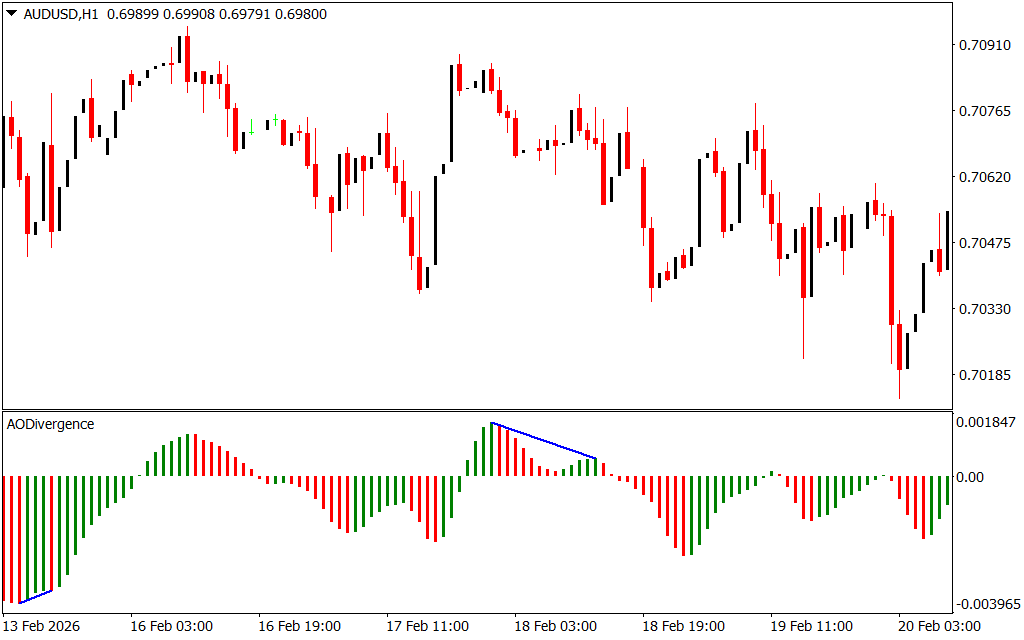
- Histogram bars display momentum:
- Green bars → uptrend
- Red bars → downtrend
- Blue divergence lines highlight potential trend reversals.
- Arrows mark actionable BUY and SELL signals.
Mechanics:
- Bullish divergence: Price makes lower lows while the histogram rises → buy signal.
- Bearish divergence: Price makes higher highs while the histogram falls → sell signal.
- Zero line cross:
- Histogram crossing from below → BUY signal
- Histogram crossing from above → SELL signal
How to Trade with AO Divergence
Buy Setup
- Bullish divergence appears on the chart.
- Histogram shows green bars or crosses zero from below.
- Enter a BUY position with stop loss below the previous swing low.
Sell Setup
- Bearish divergence appears on the chart.
- Histogram shows red bars or crosses zero from above.
- Enter a SELL position with stop loss above the previous swing high.
Tip: Combine with trend filters (e.g., Moving Averages, Ichimoku) or momentum tools for confirmation in sideways markets.
Advantages
✅ Automatically detects divergences → saves time analyzing swings
✅ Clear BUY/SELL arrows → intuitive for beginners
✅ Works on all timeframes and currency pairs
✅ Lightweight and easy to install on MT4
✅ Free to download
Limitations
❌ May produce false signals in sideways markets
❌ No built-in alerts (custom modification needed)
❌ Best used with confirmation tools for optimal accuracy
❌ Not a standalone tool in highly volatile conditions
Practical Example
- On GBP/USD H4:
- Bullish divergence forms → histogram rises above zero → BUY arrow appears.
- Bearish divergence forms → histogram falls below zero → SELL arrow appears.
This allows traders to pinpoint entry and exit levels accurately without manually analyzing every swing high/low.
Summary
The AO Divergence Indicator for MT4:
- Identifies trend reversals via divergences
- Uses a histogram and zero line for confirmation
- Provides arrows for exact BUY and SELL signals
- Free, beginner-friendly, and works across all timeframes
Pro Tip: For range-bound markets, combine it with RSI, OB
FAQ
2 Downloads
Published:
Mar 14, 2026 10:58 AM
Category: