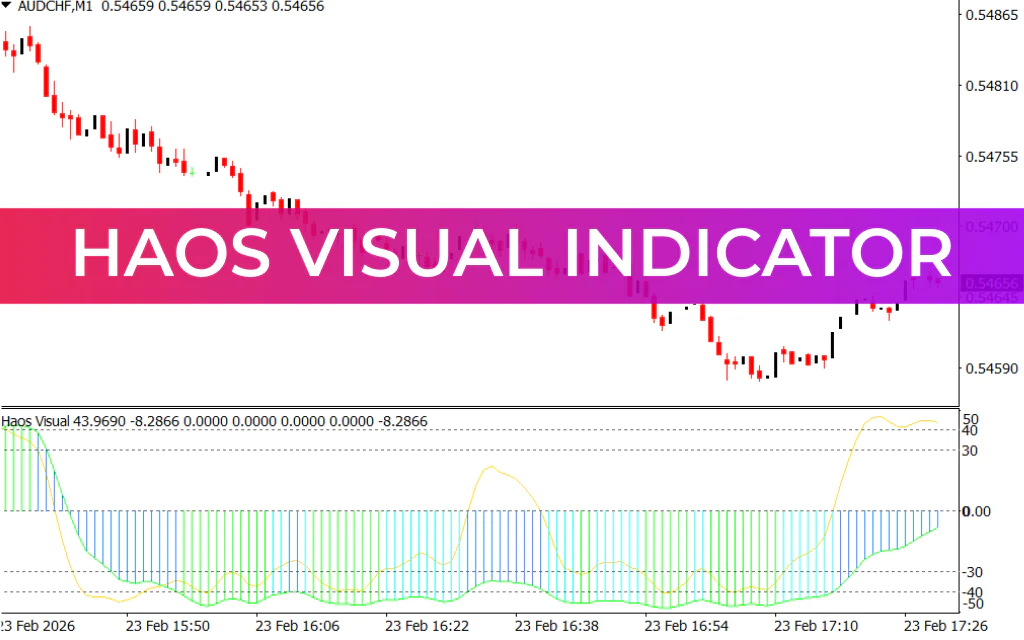
The Haos Visual Indicator is an advanced momentum and trend analysis tool designed to interpret chaotic market conditions with clarity. By combining momentum tracking, overbought/oversold detection, and Trend Strength visualization, it helps traders make informed decisions in volatile environments.
Built for MetaTrader 4, this indicator transforms complex price behavior into an easy-to-read visual format, making it suitable for scalpers, day traders, and long-term trend followers alike. Whether you're targeting quick intraday reversals or riding sustained trends, the Haos Visual Indicator enhances timing precision and trade confidence.
How the Haos Visual Indicator Works
The indicator integrates multiple analytical components into a unified visual system:
- Green Bars – Indicate strong bullish momentum and potential buying opportunities.
- Red Bars – Signal increasing bearish pressure and possible selling setups.
- Yellow Oscillating Line – Highlights overbought and oversold conditions, helping traders anticipate potential reversals.
By blending momentum strength with cycle-based oscillation, the indicator filters market noise and emphasizes high-probability setups. This structured approach allows traders to stay aligned with prevailing trends while preparing for possible turning points.
Haos Visual Indicator Trading Signals
The indicator delivers actionable insights through visual transitions and momentum shifts:
- Bullish Setup – Green bars combined with rising oscillator momentum suggest trend continuation.
- Bearish Setup – Red bars with declining oscillator values indicate downward pressure.
- Overbought Warning – Oscillator reaching extreme highs may signal exhaustion and a potential pullback.
- Oversold Opportunity – Oscillator dropping to extreme lows can indicate a potential bullish reversal.
For stronger confirmation, traders can combine the Haos Visual Indicator with support/resistance analysis, volume tools, or trend-following systems.
Key Benefits
- Clear visual representation of trend and momentum
- Overbought/oversold detection for reversal timing
- Noise reduction in volatile markets
- Suitable for multiple timeframes and assets
- Easy integration into existing trading strategies
Conclusion
The Haos Visual Indicator for MT4 provides a structured and visually intuitive way to analyze chaotic market movements. By identifying momentum shifts, extreme market conditions, and trend strength, it empowers traders to improve entry and exit timing.
Whether you trade forex, stocks, indices, or commodities, this indicator delivers clarity and precision in dynamic market conditions.
FAQ
3 Downloads
Published:
Feb 23, 2026 11:32 AM
Category: