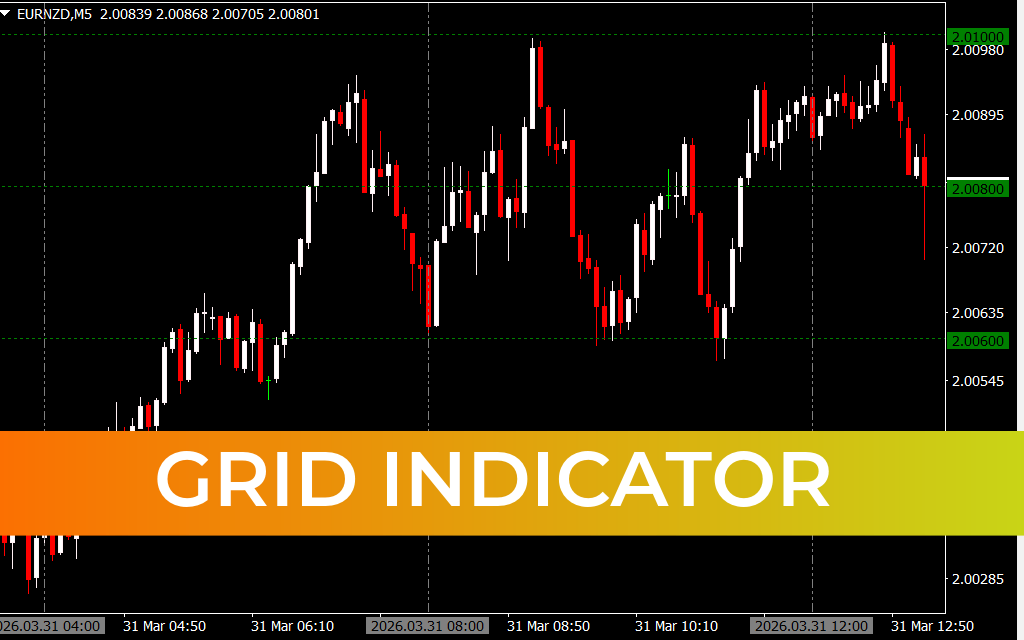
The Grid Indicator for MetaTrader 4 is a versatile custom trading tool that automatically draws horizontal grid lines and vertical period separators on your chart. Unlike the default MT4 grid, this indicator offers enhanced customization, allowing traders to adjust spacing and better visualize Market Structure.
It helps traders identify key price levels and analyze historical Price Action more effectively, making it useful for both beginners and advanced traders.
How the Grid Indicator Works
The Grid Indicator combines multiple visual elements to improve chart clarity:
- Horizontal Lines: Show equidistant price levels (e.g., every 20 pips)
- Vertical Lines: Mark trading periods or sessions
- Psychological Levels (00 Levels): Highlight key price zones where major market activity occurs
These features work together to provide a structured view of the market, helping traders make informed decisions.
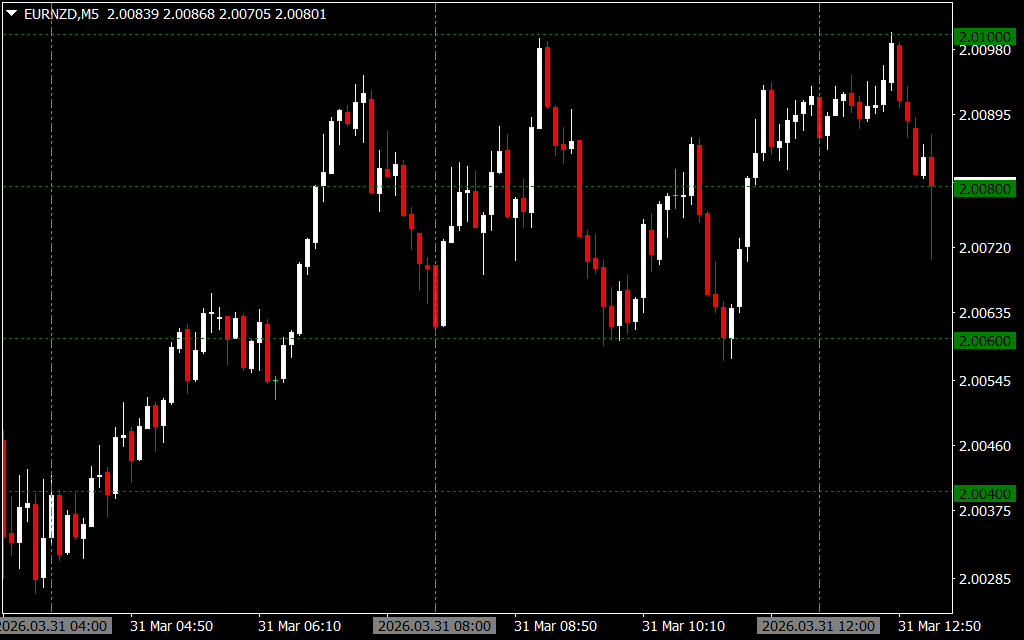
Difference Between Grid Indicator and Horizontal Grid Lines Indicator
While both indicators draw horizontal lines, the Grid Indicator offers more advanced functionality:
- Adds vertical period separators
- Highlights historical trading sessions
- Identifies psychological price levels (00 levels)
This makes it a more comprehensive tool for traders who want deeper insights into price behavior.
Key Features of Grid Indicator
1. Automatic Grid Line Plotting
Quickly adds horizontal and vertical lines without manual effort.
2. Customizable Spacing
Adjust grid spacing (e.g., 20 pips or more) to match your strategy.
3. Psychological Price Zones
Highlights important round-number levels where institutional trading activity often occurs.
4. Period Separators
Visualize different trading sessions and past price movements clearly.
How to Use the Grid Indicator for MT4
Follow these steps to get started:
- Install the indicator on your MT4 platform
- Open a forex chart (e.g., EUR/USD)
- Attach the Grid Indicator
- Customize spacing and display settings as needed
Once applied, the chart will display horizontal grid lines and vertical separators, helping you analyze price structure efficiently.
Trading Strategies Using Grid Indicator
1. Support And Resistance Identification
The horizontal lines act as dynamic support and resistance levels where price may react.
2. Psychological Level Trading
Focus on 00-levels for:
- Entry points
- Take-profit zones
- Stop-loss placement
3. Trend Analysis with Period Separators
Use vertical lines to analyze how price behaves across different sessions and identify trends.
4. Breakout and Reversal Trading
Watch for breakouts or reversal patterns around grid lines for high-probability setups.
Why Traders Use the Grid Indicator
Even though it appears simple, the Grid Indicator provides valuable insights into market behavior. It helps traders:
- Understand price structure
- Identify key trading zones
- Improve entry and exit timing
- Analyze past market sessions
Conclusion
The Grid Indicator for MT4 is a simple yet powerful tool that enhances chart readability and trading analysis. By combining horizontal grid lines, vertical separators, and psychological levels, it provides a complete view of market structure.
👉 Visit IndicatorForest.com now to download the Grid Indicator for free and take your trading analysis to the next level.
6 Downloads
Published:
Mar 31, 2026 07:15 AM
Category: