The Inverse Fisher Transform of RSI Indicator for MetaTrader 4 (MT4) is a powerful technical tool that helps traders identify high-probability entry points by combining the Relative Strength Index (RSI), moving averages, and the Fisher Transform. By smoothing price data and applying the Fisher filter, the indicator enhances traditional RSI signals and minimizes market noise, giving forex traders clearer insights for buy and sell decisions.
This makes the indicator suitable for both novice traders, who can rely on overbought and oversold levels, and advanced traders, who can integrate it into multi-timeframe (MTF) strategies with other technical tools for confluence.

How the Inverse Fisher Transform of RSI Works
- Smoothing the price – The indicator first applies a moving average to reduce market noise.
- Calculating RSI – It then calculates the RSI values on the smoothed price data.
- Applying the Fisher Transform – Finally, the Fisher filter converts the RSI values into a normalized oscillator, making overbought and oversold levels more distinct.
The result is a precise oscillator that highlights optimal entry points for trading.
Trading Signals with the Inverse Fisher Transform of RSI
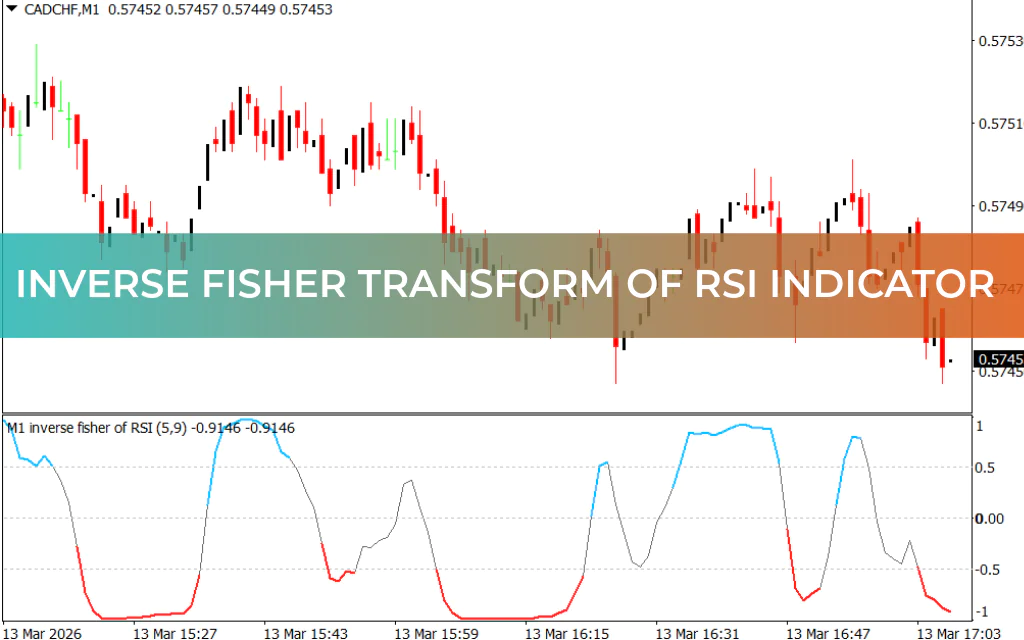
The indicator displays three key levels as dotted lines in the oscillator window:
- Overbought (Red)
- Oversold (Blue)
- Mid-level (Dim Gray)
Buy Signal (Bullish Entry)
- When the oscillator is in the oversold zone (blue), the market may be ready for a reversal.
- The best entry occurs when the oscillator line changes from Blue to Dim Gray.
- Enter a BUY trade with a stop-loss below the previous swing low.
- Exit strategy can include a risk-reward ratio above 1:2 or closing at an opposite signal.
Sell Signal (Bearish Entry)
- When the oscillator is in the overbought zone (red), a bearish reversal may be imminent.
- The ideal entry is when the line turns from Red to Dim Gray.
- Enter a SELL trade with a stop-loss above the previous swing high.
- Exit at a profitable risk-reward ratio or when an opposite trading signal occurs.
Multi-Timeframe Trading Capabilities
The Inverse Fisher Transform of RSI is flexible and works on all intraday and higher timeframes, including:
- M1, M5, M15, H1, H4
- Daily, Weekly, Monthly charts
Traders can also apply price values from other timeframes and plot them on the current chart, making it perfect for MTF trading strategies.
Benefits of Using the Inverse Fisher Transform of RSI
- Identifies precise entry points with minimal lag
- Combines RSI, moving averages, and Fisher Transform for more accurate signals
- Highlights overbought and oversold conditions clearly
- Works on all timeframes and assets, including forex, stocks, and commodities
- Helps both novice and advanced traders improve trade timing
- Free to download and easy to install on MT4
Conclusion
The Inverse Fisher Transform of RSI Indicator for MT4 is an essential tool for forex traders looking for clear and reliable buy/sell signals. By combining price smoothing, RSI, and Fisher Transform filtering, it enhances traditional RSI signals and identifies high-probability entry points.
Whether used alone or as part of a multi-timeframe strategy, this indicator can improve trade precision and help traders achieve better risk-to-reward outcomes. With free availability, it is accessible for all MT4 users.
FAQ
Published:
Mar 13, 2026 12:09 PM
Category: