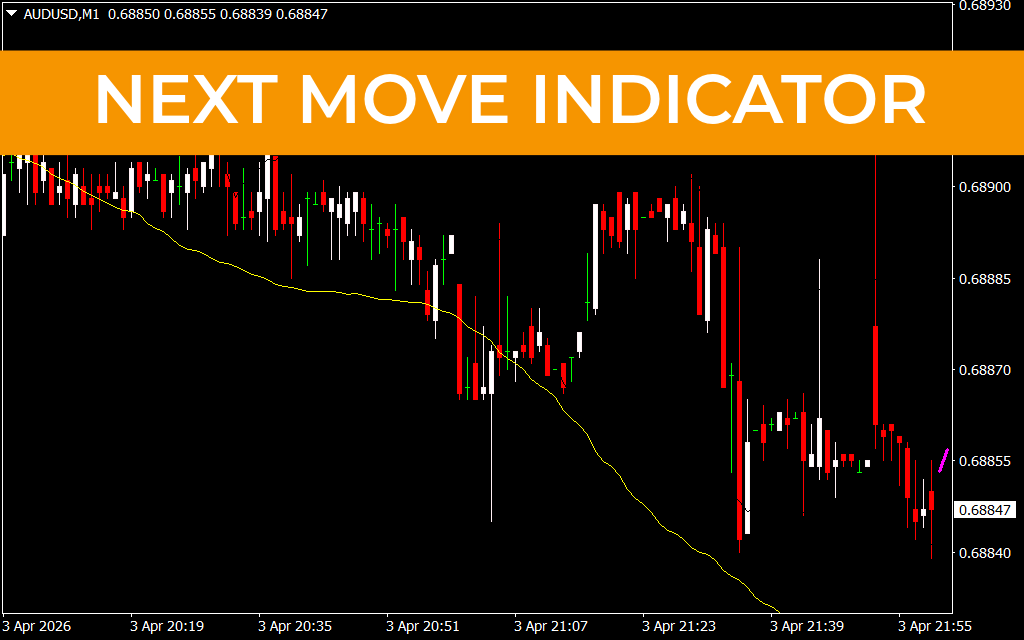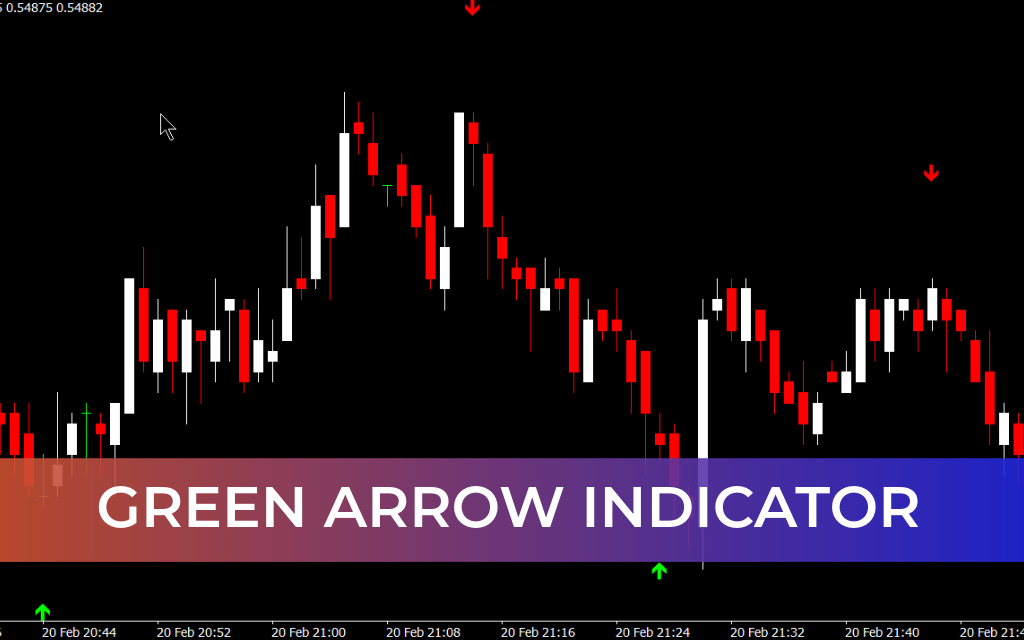
The Green Arrow Indicator for MT4 is a signal-based technical tool that displays potential BUY and SELL opportunities directly on the price chart. Built on a combination of classic technical components such as moving averages, RSI, Bollinger Bands, and momentum filters, it is designed to reduce market noise while providing clear directional arrows.
Instead of overwhelming traders with multiple indicators, the Green Arrow Indicator simplifies decision-making by combining several analytical layers into one clean visual system.
Intelligent Multi-Indicator Logic
Under the hood, the indicator blends:
Trend-following elements (moving averages)
Momentum confirmation (RSI and strength filters)
Volatility measurements (Bollinger Bands)
Internal power-based calculations
By aligning these internal conditions, the indicator filters out weak setups and focuses on higher-probability trade opportunities. It adapts to momentum shifts and trend direction rather than attempting to predict random tops or bottoms.
This makes it particularly effective in structured market environments where price respects trends and technical levels.
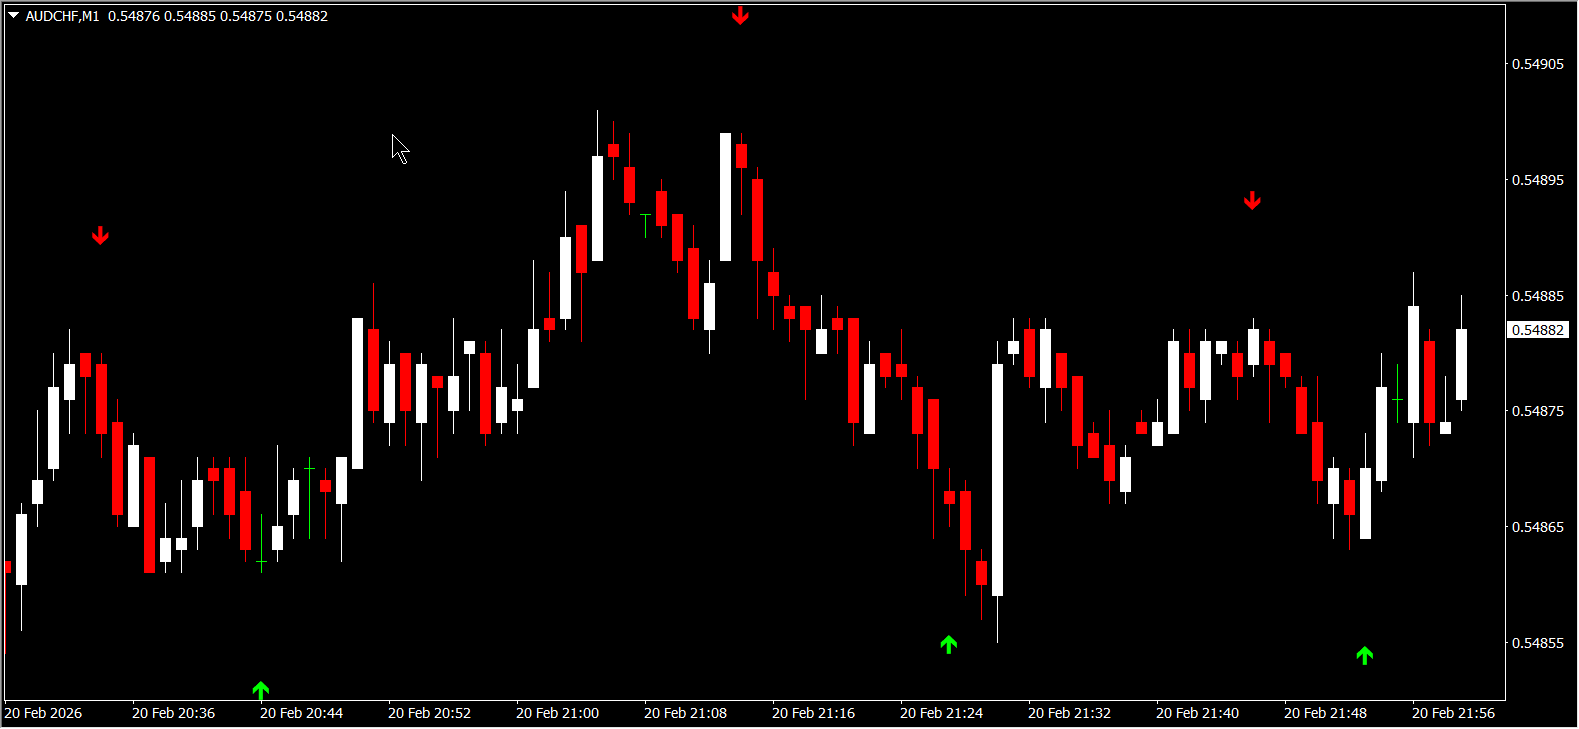
Green Arrow Indicator Trading Signals
Signals appear directly on the chart as:
Green arrows below price – Potential BUY setups
Red arrows above price – Potential SELL setups
Arrows are generated when multiple internal conditions align, including trend direction, momentum strength, and volatility filtering. Rather than acting as instant “click-and-trade” commands, these arrows should be viewed as high-probability entry zones.
Practical Trading Behavior
Green arrows commonly appear during pullbacks within bullish trends, offering structured entries with improved risk placement.
Red arrows often form during corrective highs in bearish phases.
Signals are not excessively frequent, helping reduce emotional overtrading.
For improved accuracy, signals perform best when aligned with:
Higher-timeframe trend direction
Key Support And Resistance levels
Clear Market Structure
Suitable for Multiple Trading Styles
The Green Arrow Indicator works well for:
Intraday traders
Short-term swing traders
Traders who prefer visual, rule-based systems
Those seeking clarity without chart clutter
It integrates smoothly into structured trading plans and can serve as a confirmation tool within broader strategies.
Conclusion
The Green Arrow Indicator for MT4 is a practical and visually clean trading tool for traders who prefer simplified, rule-based entry signals. By combining multiple technical filters into one streamlined system, it supports disciplined execution without unnecessary complexity.
When paired with higher-timeframe analysis and proper risk management, it becomes a reliable addition to any structured trading workflow.

FAQ
25 Downloads
Published:
Feb 21, 2026 11:55 AM
Category: