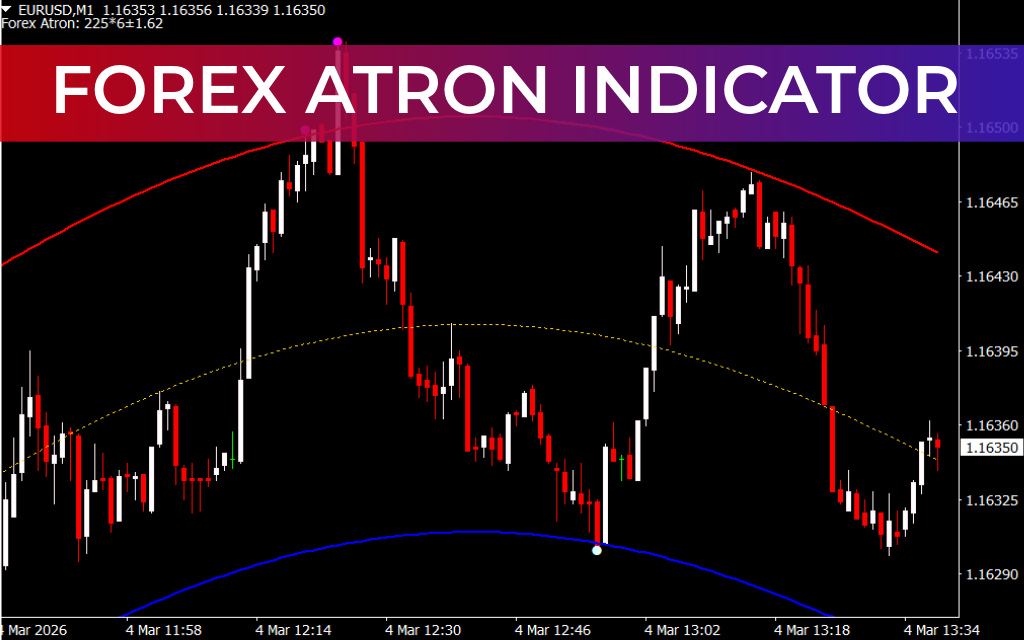
The Forex Atron Indicator for MT4 is a volatility-based trading tool designed to highlight potential trend reversals and price extremes. By plotting three dynamic bands on the chart, this indicator helps traders assess market volatility and identify optimal entry points for buy and sell trades.
It is ideal for traders who want a visual representation of price movement relative to statistical averages and volatility levels.
Key Features of the Forex Atron Indicator
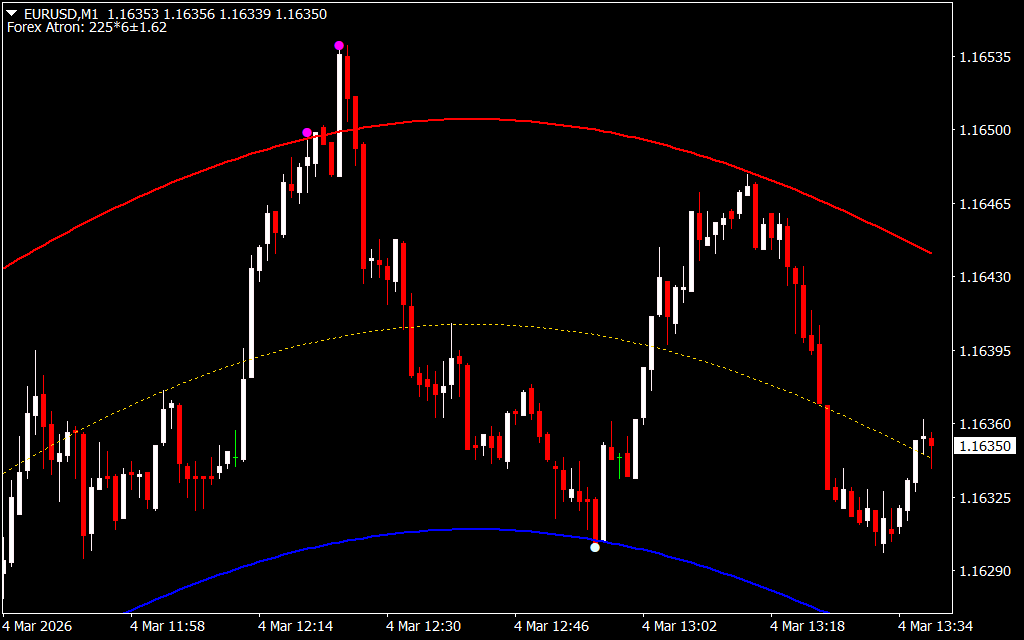
- Three Volatility Bands – Plots upper, middle, and lower bands based on standard deviation
- Upper Band (Red) → Indicates high price volatility; potential sell area
- Middle Band (Dotted Yellow) → Represents the mean price over a selected period
- Lower Band (Blue) → Indicates low price volatility; potential buy area
- Trend Reversal Signals – Helps identify potential points where the market may reverse
- Volatility Analysis – Visualizes price movement relative to statistical norms
- Multi-Timeframe Compatible – Works effectively on all MT4 timeframes
How to Use the Forex Atron Indicator in MT4
Applied to a chart like GBP/JPY on the H4 timeframe:
Buy Signal
- Price touches or approaches the lower blue band
- Suggests potential upward reversal
- Consider entering a long position with confirmation from other indicators
Sell Signal
- Price touches or approaches the upper red band
- Suggests potential downward reversal
- Consider entering a short position with additional Trend Confirmation
Tip: For more reliable trades, combine the Forex Atron Indicator with other technical tools like moving averages, RSI, or Support And Resistance levels.
Benefits of the Forex Atron Indicator
- Provides a clear visual of market volatility
- Highlights potential buy and sell zones with simple color-coded bands
- Helps traders identify trend reversals and extreme price levels
- Suitable for Scalping, swing, and intraday strategies
- Easy to interpret and beginner-friendly
Conclusion
The Forex Atron Indicator for MT4 is a powerful tool that uses standard deviation bands to visualize market volatility and identify potential trend reversals. By monitoring price movement near the lower or upper bands, traders can make more informed buy and sell decisions.
It is practical, visually intuitive, and free to download.
FAQ
7 Downloads
Published:
Mar 04, 2026 07:40 AM
Category: