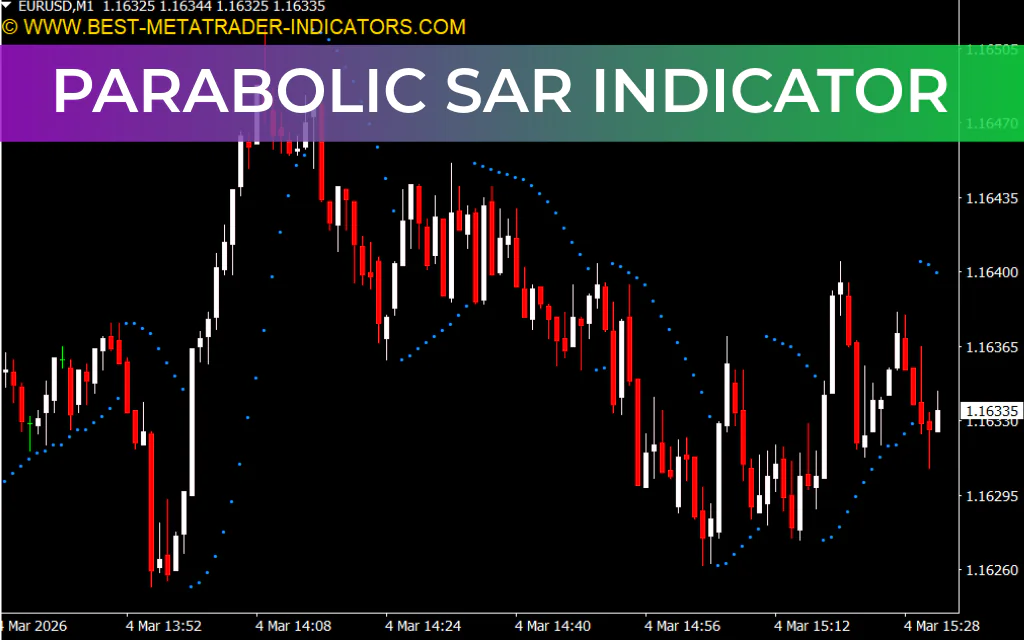
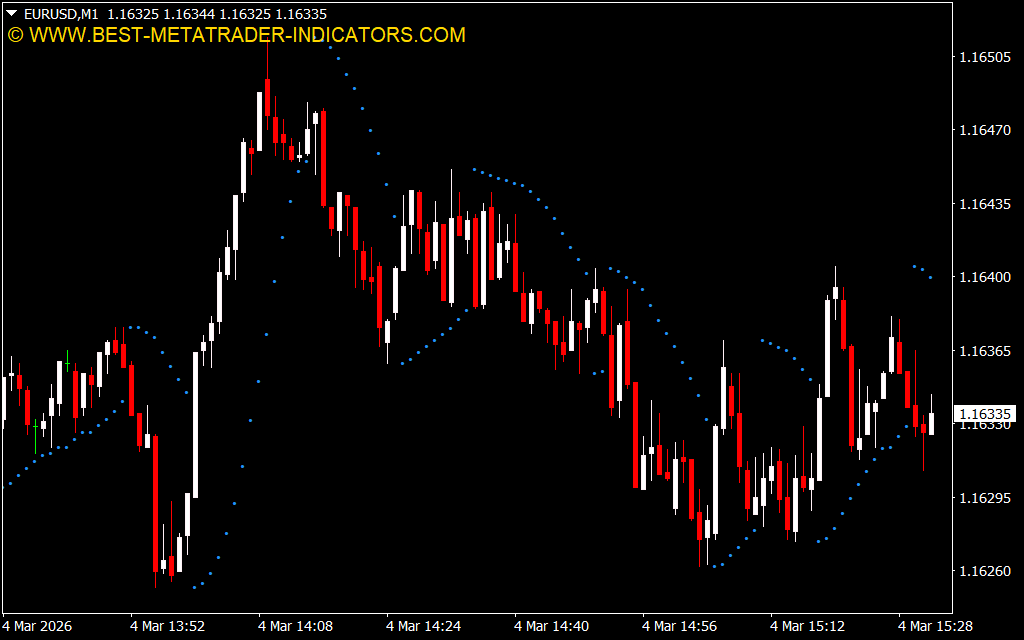
The Parabolic SAR Indicator is a classic MT4 tool developed by J. Wilder to help traders identify market trends and potential reversals. By plotting dotted lines above or below the Price Action, the indicator provides clear visual cues for trend direction and entry/exit points.
How the Parabolic SAR Indicator Works
- Dots below the price – indicate an uptrend, signaling traders to take long positions or exit short trades.
- Dots above the price – indicate a downtrend, signaling traders to take short positions or close long trades.
The dots move dynamically with price action, staying below prices during uptrends and above during downtrends.
Timeframe Flexibility
The Parabolic SAR Indicator works on any timeframe, but it is most effective on longer timeframes to reduce market noise and false signals.
Using the Parabolic SAR Indicator with Other Tools
For enhanced accuracy, traders often combine the Parabolic SAR with Moving Averages or other trend-following indicators. This combination helps confirm trends and improves trading strategy reliability.
Conclusion
The Parabolic SAR Indicator for MT4 is a reliable, easy-to-use tool for spotting trends and reversals. Its dotted line signals provide clear guidance for buy and sell positions. You can download the Parabolic SAR Indicator for free and improve your trading strategy today.
FAQ
Published:
Mar 04, 2026 09:34 AM
Category: