Free
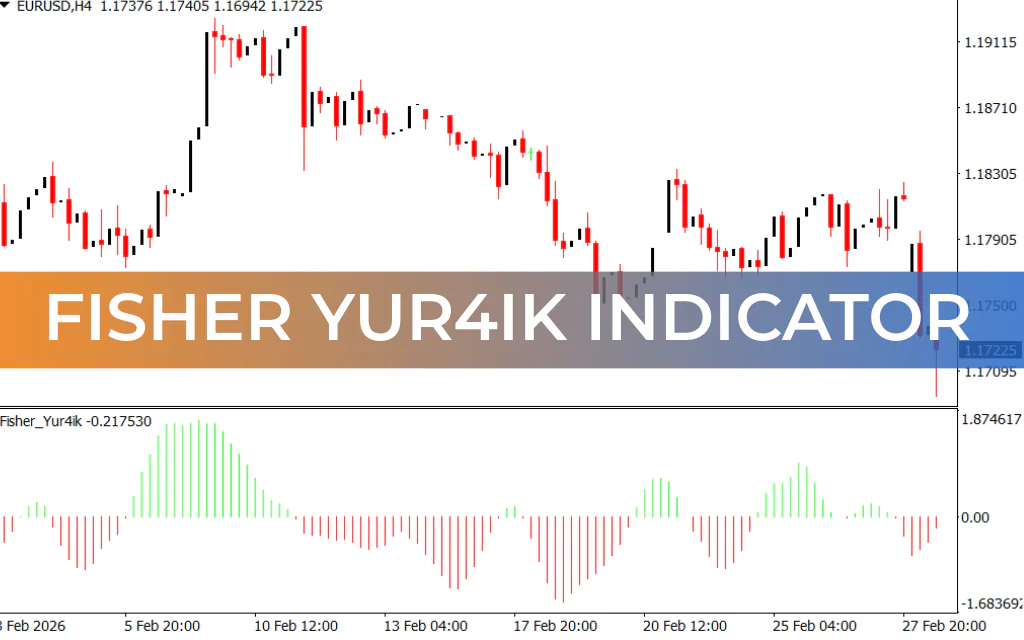
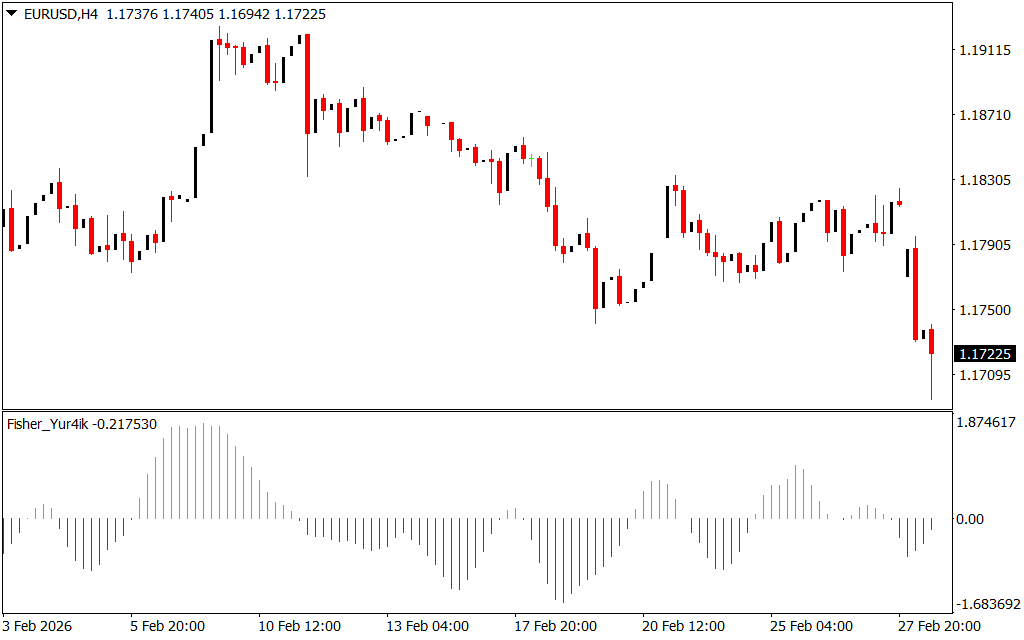
The Fisher Yur4ik Indicator is a momentum-based technical analysis tool designed for the MT4 trading platform. It is a modified version of the traditional Fisher Transform Indicator developed by John F. Ehlers, with enhancements to visualize bullish and bearish momentum more clearly.
Key Features
- Momentum Measurement:
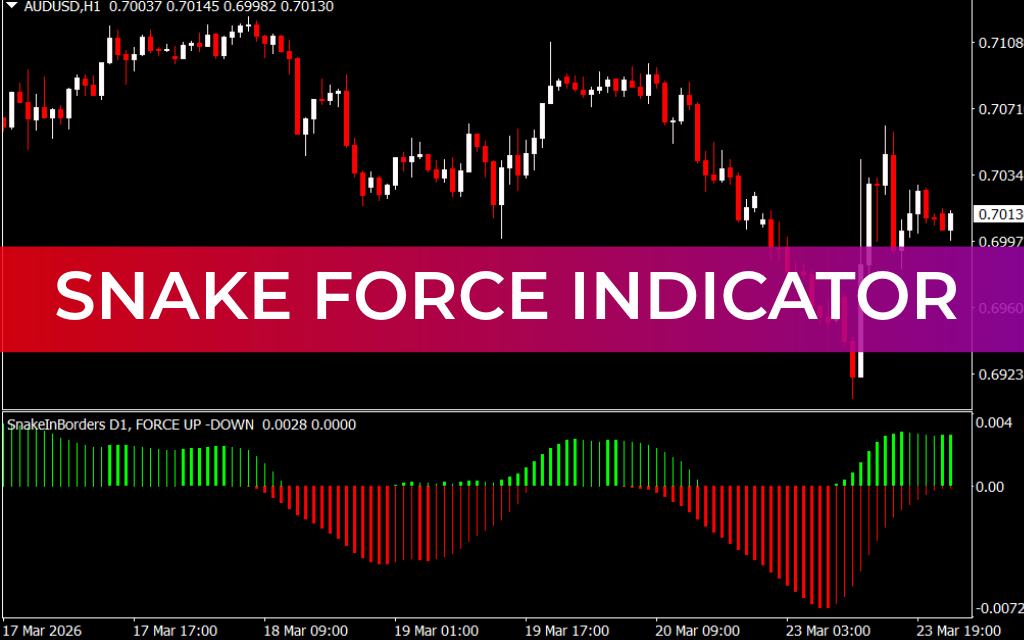
- Oscillates above and below the 0.00 neutral level, showing bullish or bearish momentum.
- Histogram Visualization:
- Green bars indicate bullish momentum.
- Red bars indicate bearish momentum.
- Trend Reversal Detection:
- Uses a mathematical transformation to normalize price data, helping identify overbought/oversold conditions and potential reversals.
- Breakout Signals:
- Helps detect momentum breakout points along price channels.
How to Use the Fisher Yur4ik Indicator for MT4
- Bullish Momentum (Buy Signal):
- Indicator crosses above 0.00 and green bars appear.
- Suggests the market is gaining upward momentum; traders may consider buy positions.
- Bearish Momentum (Sell Signal):
- Indicator crosses below 0.00 and red bars appear.
- Suggests downward momentum; traders may consider sell positions.
- Overbought/Oversold Zones:
- Extreme high levels above 0.00 may indicate overbought conditions.
- Extreme low levels below 0.00 may indicate oversold conditions.
- Confirmation:
- Combine with Price Action, support/resistance, or other indicators for more accurate trading signals.
Benefits of the Fisher Yur4ik Indicator
- Clearly visualizes market momentum using histogram bars.
- Identifies potential trend reversals and breakout points.
- Works across all MT4 timeframes.
- Complements other technical indicators for enhanced trading decisions.
Conclusion
The Fisher Yur4ik Indicator for MT4 is a momentum-based tool that helps traders detect bullish and bearish momentum, potential overbought/oversold zones, and trend reversals. By combining the histogram visualization with price action or other technical tools, traders can make more informed decisions in forex and other financial markets.
FAQ
It is a modified version of the Fisher Transform (John F. Ehlers) with enhancements to visualize bullish and bearish momentum more clearly. Oscillates above and below 0.00 neutral level. Green bars = bullish momentum. Red bars = bearish momentum. Uses mathematical transformation to normalize price data. Helps identify overbought/oversold and potential reversals.
Bullish: Indicator crosses above 0.00 and green bars appear. Market gaining upward momentum; consider buy. Bearish: Indicator crosses below 0.00 and red bars appear. Market gaining downward momentum; consider sell.
Overbought/oversold conditions. Potential reversals. Momentum breakout points along price channels.
Momentum-based traders. MT4 users. Those wanting clearer Fisher visualization.
Designed for MT4 trading platform.
Published:
Mar 02, 2026 09:53 AM
Category:
Share: