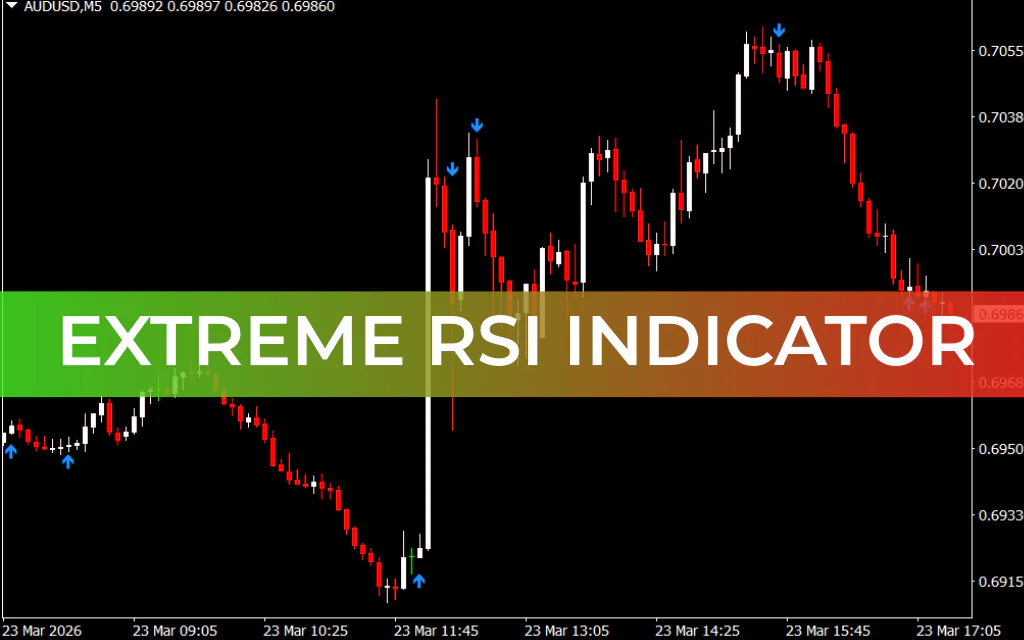
The Extreme RSI Indicator for MT4 is an enhanced version of the classic Relative Strength Index (RSI), designed to provide clear trend direction signals through visual arrows. Instead of focusing solely on overbought and oversold levels, this indicator highlights strong market trends, making it easier for traders to identify momentum and act accordingly.
With its non-repainting arrow signals, the Extreme RSI Indicator offers a reliable and user-friendly approach to trend trading.
How the Extreme RSI Indicator Works
The indicator is built on standard RSI calculations, but with a key improvement—it translates RSI data into blue arrow signals that reflect strong market trends:
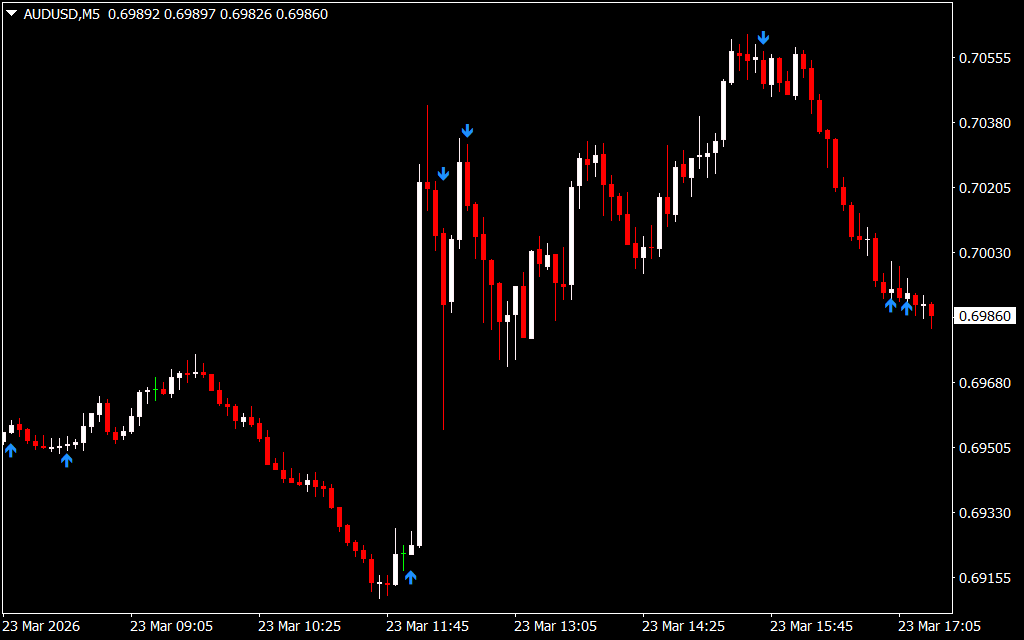
- Blue arrow on bullish candle: Indicates a strong uptrend (buy signal)
- Blue arrow on bearish candle: Indicates a strong downtrend (sell signal)
Unlike the traditional RSI, it does not display overbought/oversold zones. Instead, it focuses purely on Trend Strength and continuation.
The indicator is non-repainting, meaning once a signal appears, it remains fixed on the chart for reliable analysis.
How to Trade With the Extreme RSI Indicator
Buy Signal (Uptrend)
- A blue arrow appears on a bullish candle
- Confirms strong upward momentum
- Enter a buy (long) position in the direction of the trend
Sell Signal (Downtrend)
- A blue arrow appears on a bearish candle
- Indicates strong downward momentum
- Enter a sell (short) position
Trend Continuation Signals
The indicator may plot multiple arrows during a strong trend, which suggests trend continuation rather than reversal. This allows traders to:
- Add to existing positions
- Stay in trades longer
- Ride strong trends more effectively
Example
On a GBP/CHF H4 chart, multiple blue arrows appear during a sustained trend. These signals help traders follow the momentum and identify optimal entry points within the trend.
Important Trading Tips
- Use the indicator on higher timeframes to reduce false signals
- Combine with support/resistance, moving averages, or MACD for confirmation
- Avoid relying solely on arrows in sideways markets
- Apply proper risk management strategies
Advantages of the Extreme RSI Indicator
- Non-repainting signals for consistent results
- Easy-to-read arrow-based system
- Highlights strong trends and momentum
- Suitable for beginners and advanced traders
- Works across multiple trading styles
Limitations
- Does not show overbought/oversold levels
- May produce false signals in ranging markets
- Requires confirmation tools for higher accuracy
Conclusion
The Extreme RSI Indicator for MT4 is a powerful upgrade to the traditional RSI, focusing on trend strength and continuation signals rather than just reversal zones. Its clear arrow signals and non-repainting nature make it a dependable tool for traders aiming to follow strong market momentum.
For best results, combine it with other technical tools and apply it on higher timeframes.
Download the Extreme RSI Indicator for MT4 for free and trade strong trends with confidence.
FAQ
7 Downloads
Published:
Mar 23, 2026 12:27 PM
Category: