The Elliott Fibonacci Indicator for MT4 is a powerful technical analysis tool that combines two of the most respected trading concepts—Elliott Wave Theory and Fibonacci retracement levels. It automatically identifies wave structures and overlays Fibonacci levels on the chart, helping traders determine optimal entry points, stop losses, and take profit targets.
By merging wave analysis with precise price levels, this indicator simplifies complex market analysis and provides a structured approach to trading trends and corrections.
How the Elliott Fibonacci Indicator Works
The indicator performs two main functions:
1. Elliott Wave Detection
- Automatically identifies impulse (trend) waves and corrective waves
- Plots wave structures and trend lines directly on the chart
- Helps traders determine whether the market is in a bullish or bearish phase
2. Fibonacci Level Calculation
- Draws Fibonacci retracement and extension levels on the active wave
- Highlights potential entry, stop loss, and take profit zones
- Uses Fibonacci ratios to project multiple profit targets
How to Trade With the Elliott Fibonacci Indicator
Step 1: Identify the Trend
- Uptrend: Green wave trend line moving upward → look for buy opportunities
- Downtrend: Wave structure moving downward → look for sell opportunities
Step 2: Wait for Fibonacci Retracement
- Allow price to retrace to key Fibonacci levels (e.g., 38.2%, 50%, 61.8%)
- These levels act as dynamic Support And Resistance zones
Step 3: Enter the Trade
- Enter buy trades in an uptrend at key retracement levels
- Enter sell trades in a downtrend during corrective waves
Step 4: Set Stop Loss & Take Profit
- Use nearby Fibonacci levels as stop loss and take profit zones
- Target multiple profit levels based on Fibonacci extensions
Example
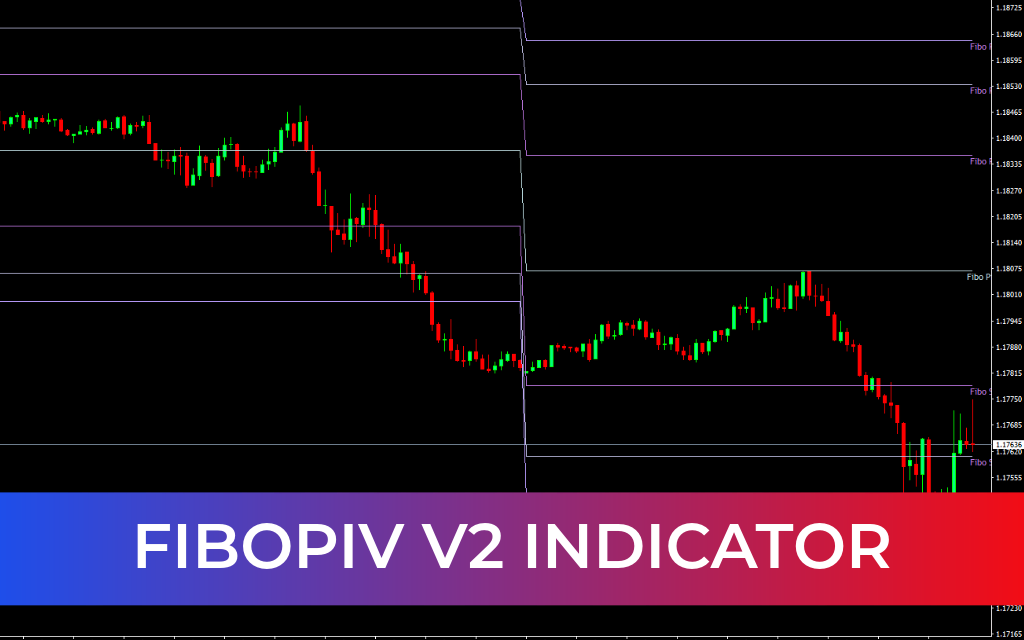
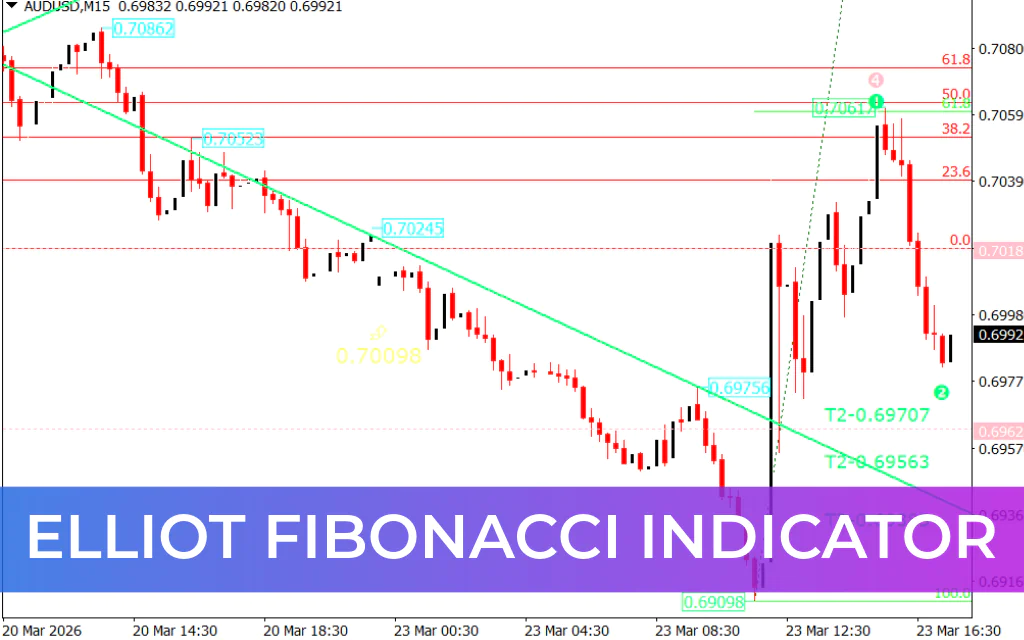
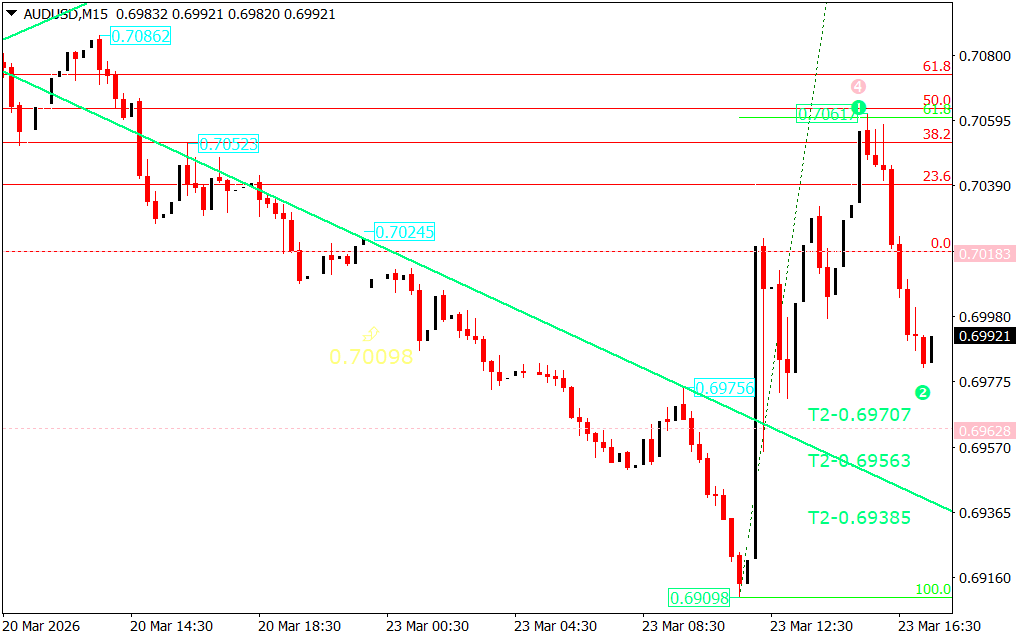
On a EUR/USD H1 chart, the indicator:
- Plots Elliott wave structures and trend lines in green
- Displays Fibonacci levels (green for upper levels, red for lower levels)
Traders can follow the trend direction and wait for price to retrace to a Fibonacci level before entering a trade. Adjacent levels can then be used for risk management and profit targets.
Advantages of the Elliott Fibonacci Indicator
- Combines Elliott Wave Theory and Fibonacci analysis in one tool
- Automatically identifies wave counts and Market Structure
- Provides clear entry, stop loss, and take profit levels
- Suitable for trend-following strategies
- Ideal for intermediate and advanced traders
Important Trading Tips
- Learn the basics of Elliott Wave Theory for better interpretation
- Use higher timeframes for more reliable wave structures
- Combine with Price Action or momentum indicators for confirmation
- Be cautious in sideways markets, where wave structures may be unclear
Limitations
- Requires understanding of wave theory for best results
- May produce complex signals for beginners
- Wave counts can vary in highly volatile markets
Conclusion
The Elliott Fibonacci Indicator for MT4 is an advanced trading tool that simplifies the process of combining wave analysis and Fibonacci ratios. By automatically identifying market structure and key price levels, it helps traders make more informed and strategic trading decisions.
Whether you’re analyzing trends or planning precise entries, this indicator offers a comprehensive framework for forex trading success.
Download the Elliott Fibonacci Indicator for MT4 for free and elevate your technical analysis today.
SEO Meta Description
FAQ
3 Downloads
Published:
Mar 23, 2026 12:36 PM
Category: