to analyze two timeframes simultaneously within a single indicator window. By combining the MACD of the current chart with that of a higher timeframe, this tool helps traders confirm trend direction and improve trade accuracy.
Instead of switching between charts, traders can instantly compare short-term and higher timeframe momentum—making it easier to align trades with the broader market trend.
Key Features
- Dual timeframe analysis: Displays MACD for current and higher timeframe
- Histogram + signal lines: Clear visualization of momentum and trend
- Trend Confirmation: Helps filter false signals using higher timeframe bias
- Flexible usage: Works across all chart timeframes
- Automation-friendly: Suitable for algorithmic and EA-based strategies
How the Indicator Works
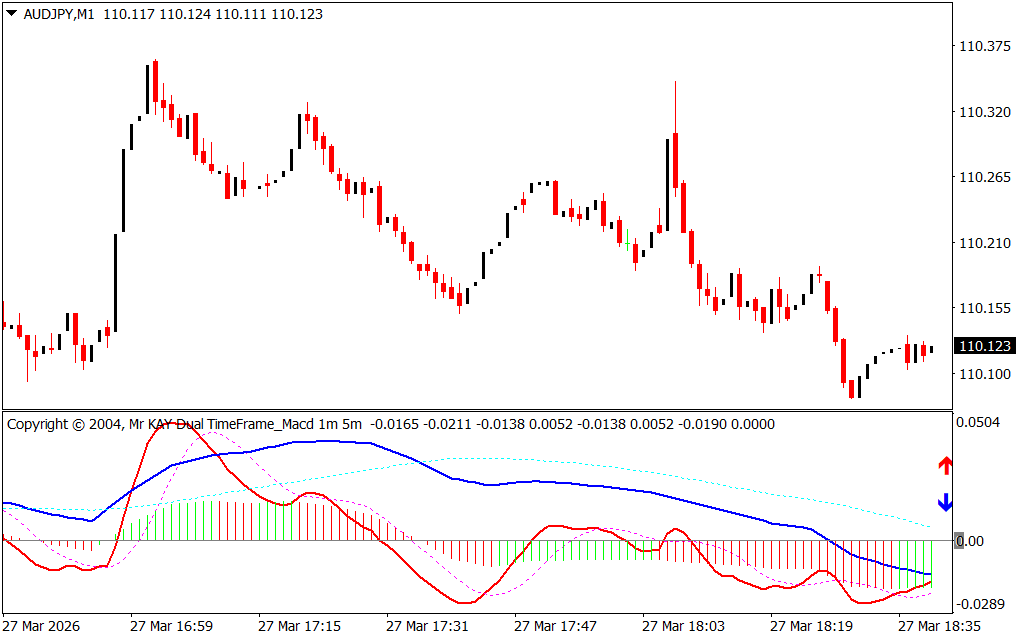
The indicator combines two MACD readings in one window:
- Current timeframe MACD: Displayed with histogram bars
- Higher timeframe MACD: Shown as MACD and signal lines
This setup allows traders to quickly assess whether both timeframes are aligned or diverging.
Dual Time Frame MACD Trading Strategies
This indicator supports multiple trading approaches depending on your style:
1. Zero Line Crossover Strategy (Conservative)
- Watch for histogram bars crossing the ZERO line
- Enter trades only if the higher timeframe confirms the same direction
- Buy: Histogram crosses above zero + higher timeframe bullish
- Sell: Histogram crosses below zero + higher timeframe bearish
2. MACD Line & Signal Line Crossover (Aggressive)
- Enter trades when the MACD line crosses the signal line
- Confirm the trade direction with higher timeframe trend
- Offers earlier entries but carries higher risk
3. Dual MACD Line Crossover Strategy
- Red line = Current timeframe MACD
- Blue line = Higher timeframe MACD
Buy Signal:
- Red line crosses above blue line → bullish momentum
Sell Signal:
- Red line crosses below blue line → bearish momentum
Best Practices
- Higher timeframes (H1, H4, Daily) tend to produce more reliable signals
- Always combine with support/resistance or Price Action for confirmation
- Avoid trading during low volatility or sideways markets
Conclusion
The Dual Time Frame MACD Indicator for MT4 is an essential tool for traders who rely on multi-timeframe analysis. By aligning momentum across two timeframes, it helps reduce false signals and improves overall trading precision—making it ideal for both manual and automated trading strategies.
FAQ
Published:
Mar 27, 2026 13:44 PM
Category: