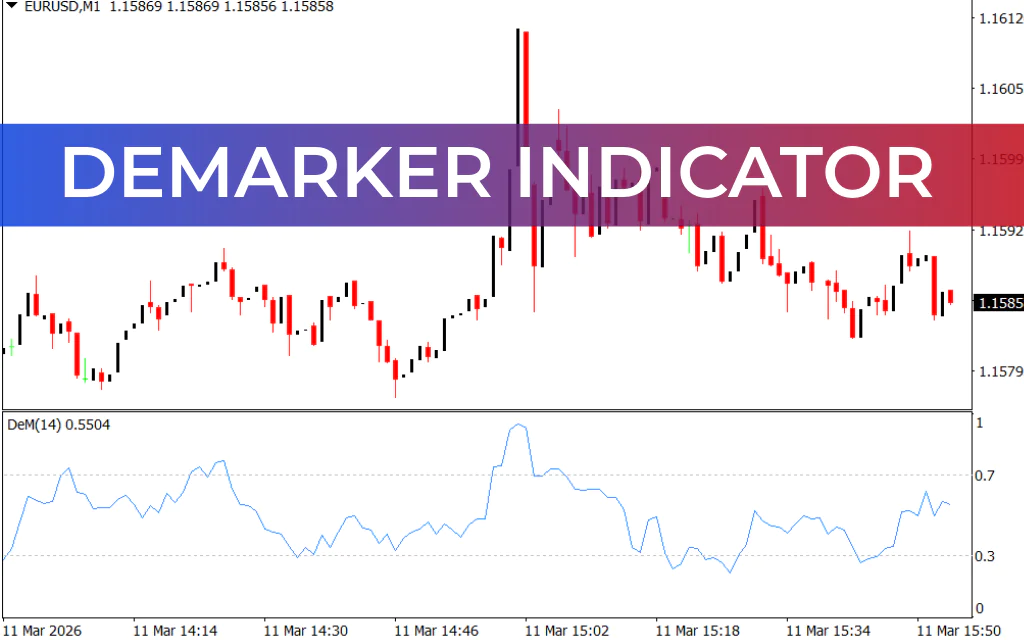
The DeMarker Indicator for MetaTrader 4 (MT4) is a trend-following tool designed for intraday Forex and stock trading. It analyzes market momentum, identifies overbought and oversold zones, and highlights potential trend reversals. In addition to buy/sell signals, the indicator detects bullish and bearish divergences and recognizes trend continuation patterns, helping traders find strong breakout and pullback opportunities.

How the DeMarker Indicator Works
The DeMarker Indicator is plotted in a separate oscillator window with two critical horizontal levels:
- 0.7 level – Marks the overbought zone
- 0.3 level – Marks the oversold zone
Buy Signal
A potential buy opportunity occurs when:
- The indicator value rises above 0.3, signaling the oversold period has ended
- Price confirms bullish momentum, e.g., a bullish candlestick pattern or support rejection
Example: If EUR/USD rejects a key horizontal support and DeMarker rises above 0.3, it indicates a potential bullish trend. Traders can look for confirmation with bullish pin bars or engulfing candles before entering a long position.
Sell Signal
A potential sell opportunity occurs when:
- The indicator value drops below 0.7, signaling the overbought period is over
- Price confirms bearish momentum, e.g., a bearish candlestick pattern or resistance rejection
Traders can enter short positions while monitoring Price Action and other indicators for confirmation.
Best Practices
- Use the DeMarker Indicator primarily for intraday trading on MT4
- Avoid relying solely on the indicator during choppy or sideways markets
- Combine with price action tools such as candlestick patterns, trendlines, and support/resistance levels for higher accuracy
- Monitor divergences for spotting trend reversals or continuation opportunities
Conclusion
The DeMarker Indicator for MT4 is an ideal tool for beginners and intraday traders seeking to monitor market momentum, trend direction, and overbought/oversold conditions. By combining its signals with price action analysis, traders can identify high-probability buy and sell opportunities and improve their trading decisions.
You can download the DeMarker Indicator for free and integrate it into your MT4 trading setup today.
FAQ
Published:
Mar 11, 2026 10:55 AM
Category: