The Bdfx Trender Indicator for MetaTrader 4 (MT4) is a powerful trend-following tool that helps traders identify three important market conditions: bullish, bearish, and neutral trends. The indicator displays these conditions using a clear histogram, making it easier for traders to analyze market direction quickly.
By detecting neutral market phases, the indicator helps traders avoid sideways markets and focus only on strong trending opportunities. This allows traders to open BUY or SELL trades during clear trends while staying out of uncertain market conditions.
How the Bdfx Trender Indicator Works
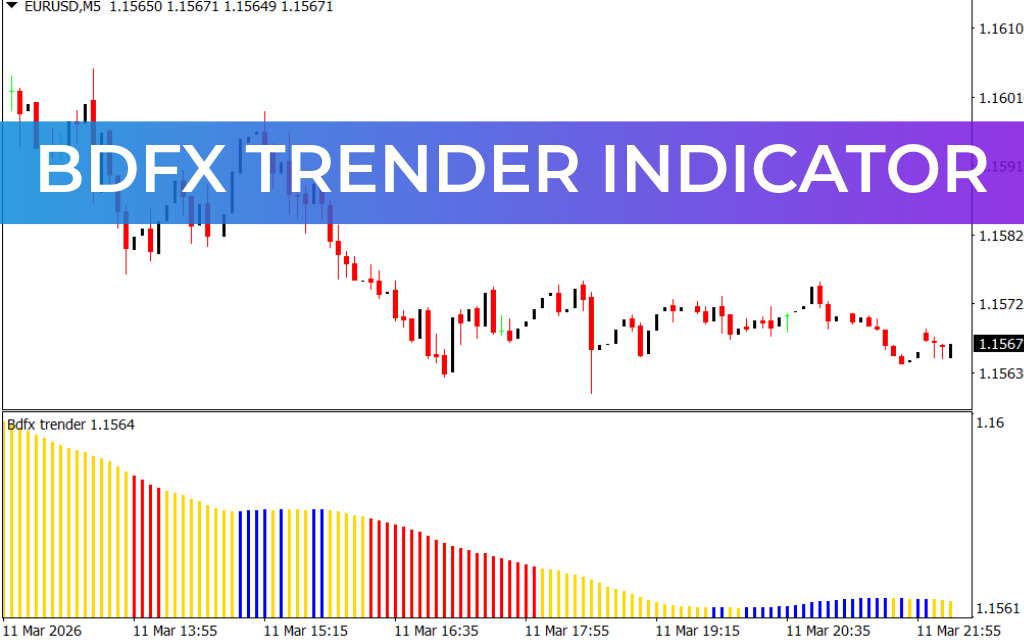
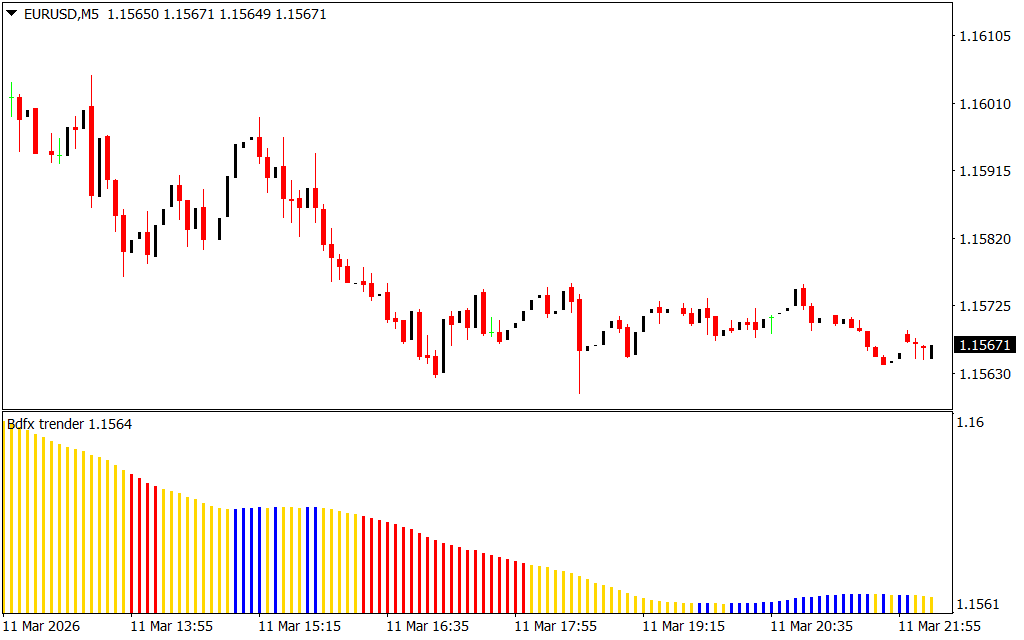
The Bdfx Trender Indicator displays its signals in a separate histogram window on the chart. Each histogram color represents a specific market condition:
- Blue Bars – Bullish trend
- Red Bars – Bearish trend
- Yellow Bars – Neutral or sideways market
This visual approach helps traders instantly recognize the current market trend and adjust their trading strategies accordingly.
The indicator works effectively across multiple timeframes, including:
- Intraday charts
- Daily charts
- Weekly charts
- Monthly charts
Because of this flexibility, it is suitable for scalpers, short-term traders, and long-term investors.
Key Features of the Bdfx Trender Indicator
The Bdfx Trender Indicator offers several useful benefits:
- Detects bullish, bearish, and neutral market trends
- Easy-to-read color-coded histogram
- Helps traders avoid sideways market conditions
- Works on multiple timeframes
- Suitable for manual and automated trading strategies
- Ideal for both beginner and advanced traders
Beginner traders can quickly identify market direction, while experienced traders can incorporate the indicator into automated or algorithmic trading systems.
Bdfx Trender Indicator Trading Signals
When applied to a chart (such as GBPUSD H1), the indicator displays histogram bars that change color depending on the market trend.
BUY Signal
When the histogram changes to Blue, it indicates the beginning of a bullish trend.
Trading steps:
- Enter a BUY position when the blue bar appears.
- Place the Stop Loss below the previous swing low.
- Hold the position while the trend continues.
- Exit the trade when the histogram changes color or when your profit target is reached.
SELL Signal
When the histogram changes to Red, it signals the start of a bearish trend.
Trading steps:
- Enter a SELL position when the red bar appears.
- Place the Stop Loss above the previous swing high.
- Hold the position while the bearish trend continues.
- Exit the trade when the histogram changes color or based on your risk-reward target.
Using the Indicator with Top-Down Analysis
The Bdfx Trender Indicator works especially well with top-down technical analysis.
This method involves:
- Analyzing higher timeframes (Daily, Weekly) to determine the overall trend.
- Switching to lower timeframes (H1, M15) to find precise entry points.
Lower timeframe charts often show retracements or pullbacks, which provide ideal opportunities to enter trades in the direction of the higher timeframe trend.
Trading with the larger trend direction significantly improves the chances of consistent profitability.
Conclusion
The Bdfx Trender Indicator for MT4 is a reliable trend-following tool that helps traders identify bullish, bearish, and neutral market conditions. With its clear histogram display and simple color signals, it makes market analysis easier for traders of all experience levels.
Whether you are a scalper, day trader, or long-term trader, this indicator can help you stay aligned with the market trend and make smarter trading decisions.
FAQ
Published:
Mar 11, 2026 17:35 PM
Category: