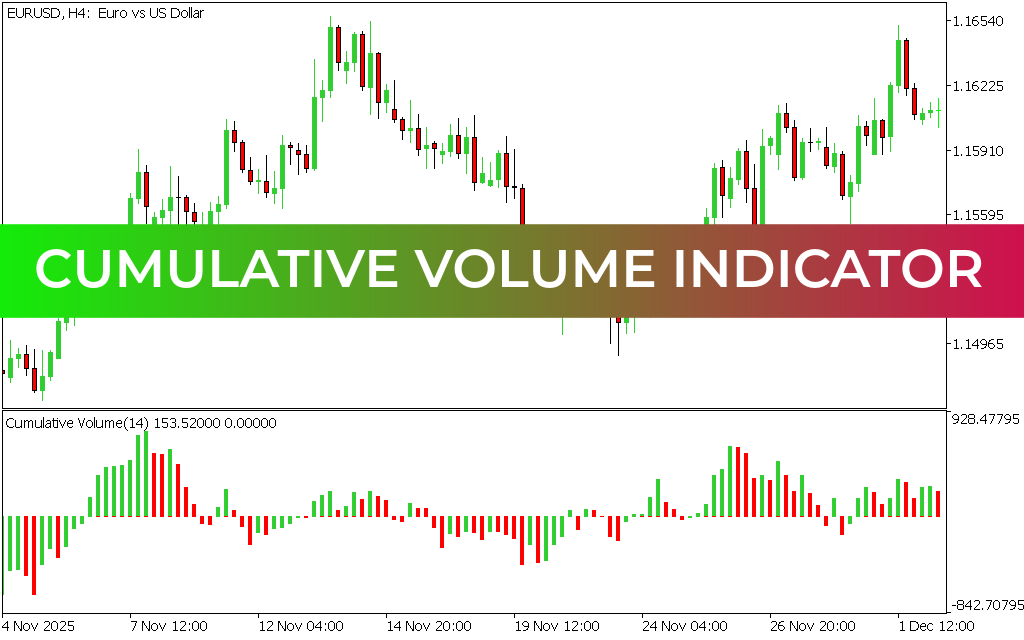
The Cumulative Volume Indicator (CVI) for MT5 is a technical analysis tool that measures and tracks the total accumulated trading volume over a specific period. It helps traders understand market participation, Trend Strength, and potential reversal points by analyzing how volume builds over time.
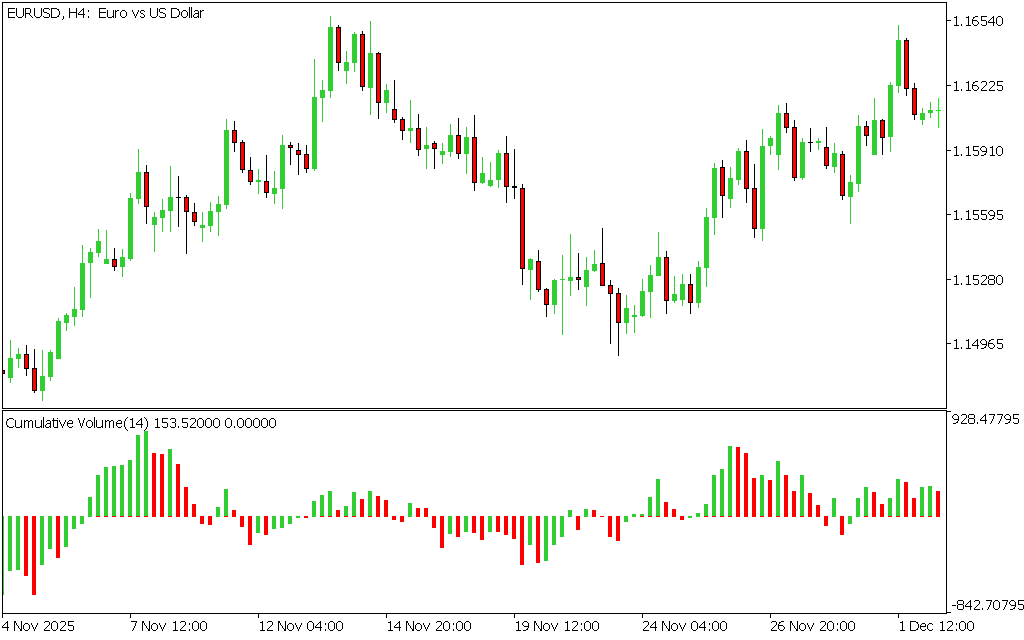
Unlike simple volume indicators, CVI focuses on cumulative pressure from buyers and sellers, making it useful for confirming price trends and filtering false signals.
What Is the Cumulative Volume Indicator?
The CVI calculates volume by continuously adding trading volume across periods and normalizing it over time. The result is plotted as a line on the chart that reflects overall market participation.
- Rising CVI → increasing buying interest / stronger trend
- Falling CVI → increasing selling pressure / weakening trend
This makes it a useful confirmation tool for both trend-following and reversal strategies.
Key Features of CVI Indicator for MT5
- Measures cumulative trading volume over time
- Helps confirm trend strength
- Filters out false breakout signals
- Works across all forex pairs and timeframes
- Useful for Scalping, intraday, and swing trading
- Complements Price Action and trend indicators
How the Cumulative Volume Indicator Works
The CVI is calculated by continuously adding volume values and plotting the result as a cumulative line on the chart.
Traders interpret it as follows:
- Above baseline (0 level) → bullish bias / buy pressure
- Below baseline (0 level) → bearish bias / sell pressure
Strong trends are typically supported by steadily rising volume, while weak trends often show flat or declining CVI movement.
How to Trade Using CVI Indicator
Buy Signal
A buy setup occurs when:
- CVI is rising steadily
- Market shows increasing volume participation
- Price confirms upward momentum
Entry: Enter buy trades after bullish confirmation
Stop Loss: Below recent swing low
Exit: When CVI starts flattening or reversing
Sell Signal
A sell setup occurs when:
- CVI is declining consistently
- Volume supports bearish pressure
- Price confirms downward movement
Entry: Enter sell trades after confirmation
Stop Loss: Above recent swing high
Exit: When CVI shows reversal or divergence
Using CVI for Signal Confirmation
One of the strongest advantages of CVI is its ability to filter weak signals:
- A volume spike followed by declining CVI may indicate reversal
- Rising CVI after breakout confirms trend continuation
- Divergence between price and CVI can signal upcoming reversal
This makes CVI especially useful when combined with breakout strategies.
Best Timeframes for CVI
The CVI Indicator works on all timeframes but is most effective on:
- M15 and H1 for intraday trading
- H4 for swing trading
- Daily charts for long-term trend analysis
Recommended Indicator Combinations
For better accuracy, combine CVI with:
- Moving Averages (trend direction)
- RSI (momentum confirmation)
- Support & Resistance levels
- Price action patterns
This helps confirm signals and reduce false entries.
Conclusion
The Cumulative Volume Indicator (CVI) for MT5 is a powerful volume-based tool that helps traders understand market strength and trend participation. By analyzing cumulative volume behavior, traders can better confirm breakouts, filter false signals, and identify potential reversals.
When used with other technical tools and proper risk management, CVI can significantly improve trading decision-making.
Published:
Apr 13, 2026 08:35 AM
Category: