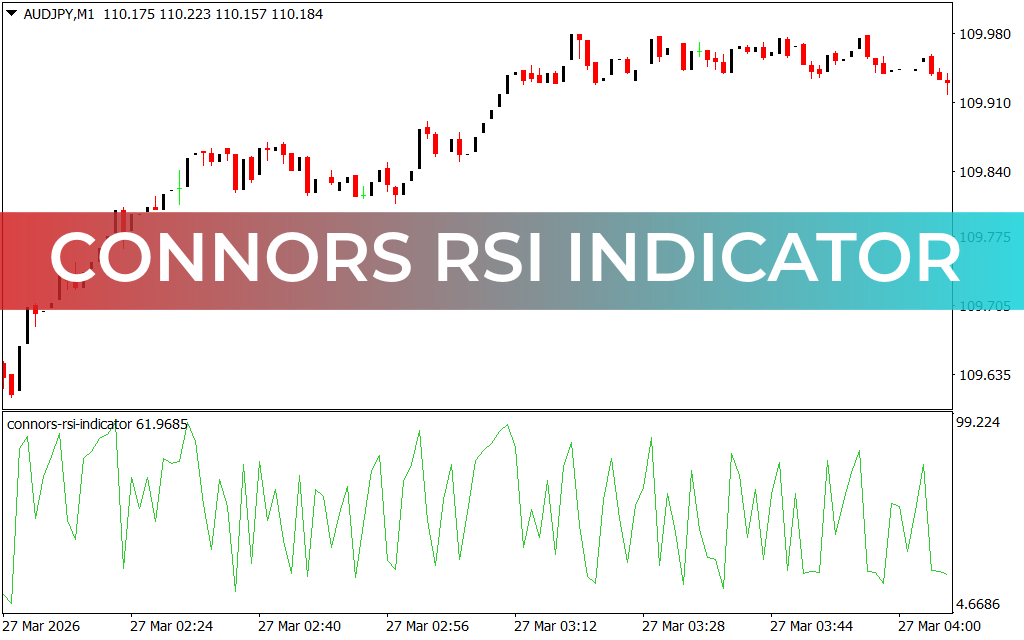
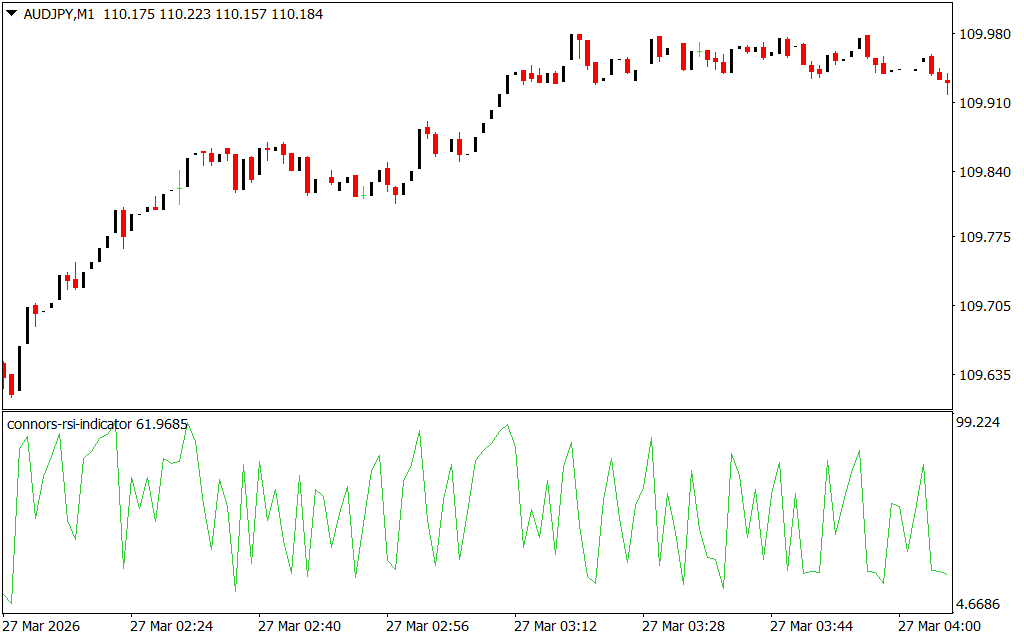
The Connors RSI is an improved version of the traditional Relative Strength Index, developed by Larry Connors. Unlike the standard RSI, which typically uses a 14-period setting, Connors RSI uses a 2-period setting, making it more responsive to short-term price movements.
- Overbought level: 90
- Oversold level: 10
- Timeframe: Works on any chart (M1–Monthly)
- Pairs: Suitable for all currency pairs
How the Connors RSI Works
The Connors RSI measures overbought and oversold conditions in the market. Its faster period allows traders to react quickly to short-term reversals and price spikes. The indicator can be customized by adjusting overbought and oversold levels to fit a trader’s strategy.
Buy Signal
- Indicator falls below oversold level (10)
- Indicates that the currency pair is oversold
- Market is likely to rally
- Enter a long position
Sell Signal
- Indicator rises above overbought level (90)
- Indicates that the currency pair is overbought
- Buying pressure is likely to fade
- Enter a short position
Trading Example
- On a EUR/GBP 4-hour chart, the Connors RSI hit the overbought level.
- Buyers exited the market, causing a strong price drop.
- Later, the indicator entered the oversold zone, and a small rally followed as bears exited.
Key Benefits
- Fast-reacting indicator thanks to 2-period setting
- Helps identify short-term reversals
- Works well across all timeframes and currency pairs
- Can be combined with other indicators for confirmation
Conclusion
The Connors RSI is a highly responsive oscillator designed to detect overbought and oversold conditions more precisely than the traditional RSI. It is ideal for traders seeking short-term trade opportunities and can be paired with other technical tools for more reliable signals.
FAQ
Published:
Mar 28, 2026 19:43 PM
Category: