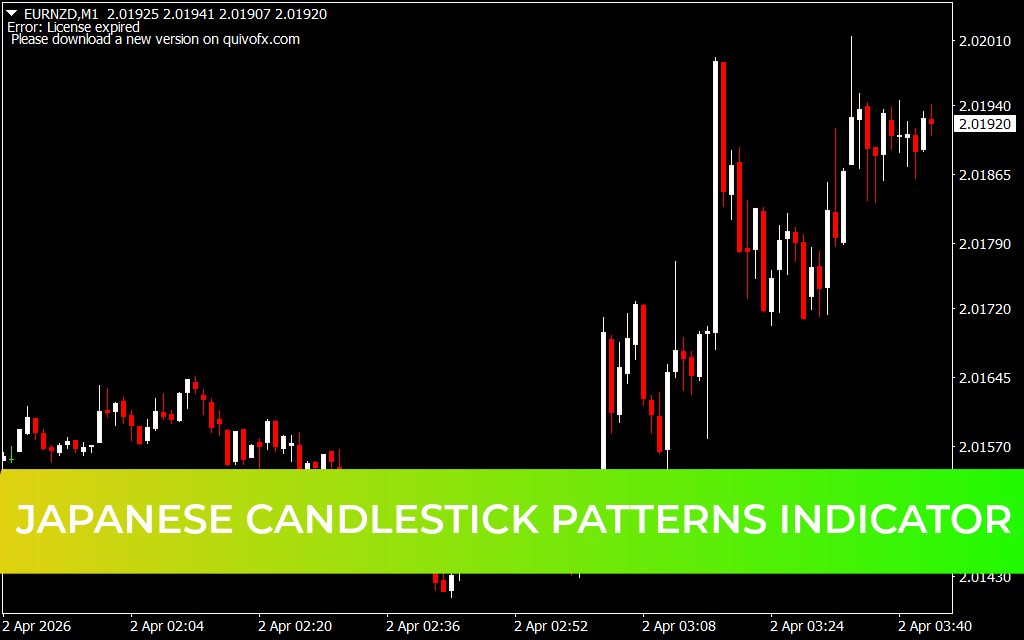
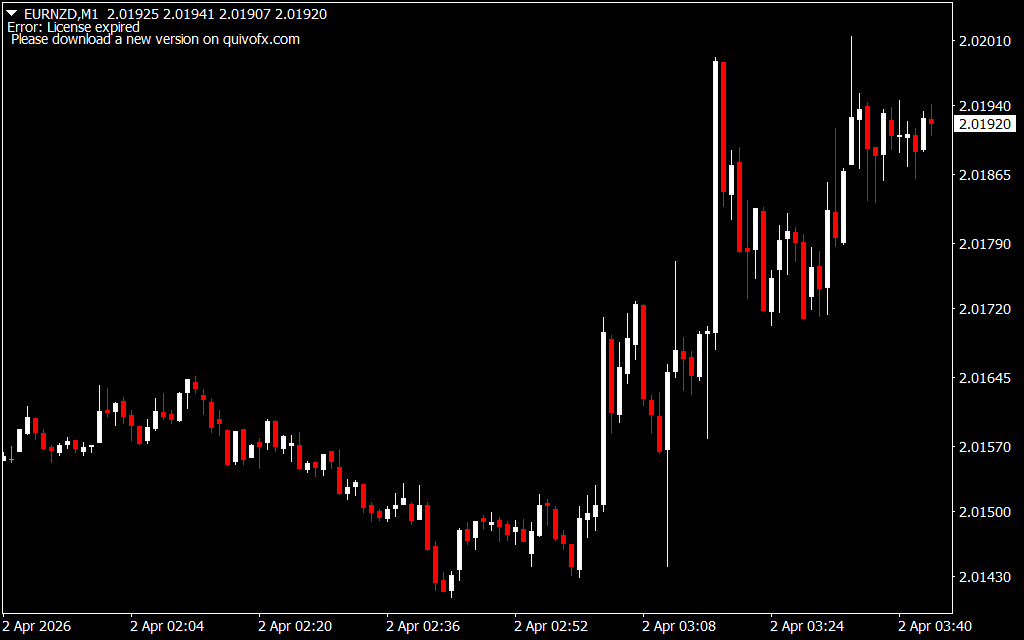
The Japanese Candlestick Patterns Indicator for MT4 is an automatic candlestick pattern detection tool designed to help traders, especially beginners, understand price structures and market sentiment. By analyzing candlestick formations, traders can anticipate potential reversals, continuation patterns, and overall Price Action.
Key Features
- Automatic Pattern Detection
The indicator scans each candle after it closes and identifies candlestick patterns without requiring traders to memorize them. It displays all detected patterns within the past 200 bars for a comprehensive market view. - Market Sentiment Analysis
Candlestick patterns reflect market psychology by showing price highs, lows, opens, and closes. Traders can use these patterns to assess potential bullish or bearish momentum. - Trend Integration
While the indicator highlights patterns, it doesn’t filter by trend. Combining it with trend indicators like moving averages helps ensure trades align with market momentum.
How to Trade Using the Indicator
- Trend-Following Signals: Use a Trend Indicator, such as a 10-day SMA, to identify market bias. For example, pick buy signals only above the SMA in a bullish trend.
- Counter-Trend Signals: Bearish or bullish patterns that fail at key levels can indicate reversals, giving traders opportunities to take short or long positions against the prevailing trend.
Example
In a daily USD/JPY chart with a 10-SMA applied, bullish candlestick patterns above the SMA resulted in successful upside moves. Meanwhile, bearish patterns near resistance levels indicated loss of momentum and potential sell opportunities.
Conclusion
Candlestick charts remain one of the most widely used technical analysis tools due to their clarity and ability to convey market sentiment quickly. The Japanese Candlestick Patterns Indicator simplifies pattern detection on MT4, making it easier for traders to enter and exit trades confidently based on price action.
4 Downloads
Published:
Apr 01, 2026 21:46 PM
Category: