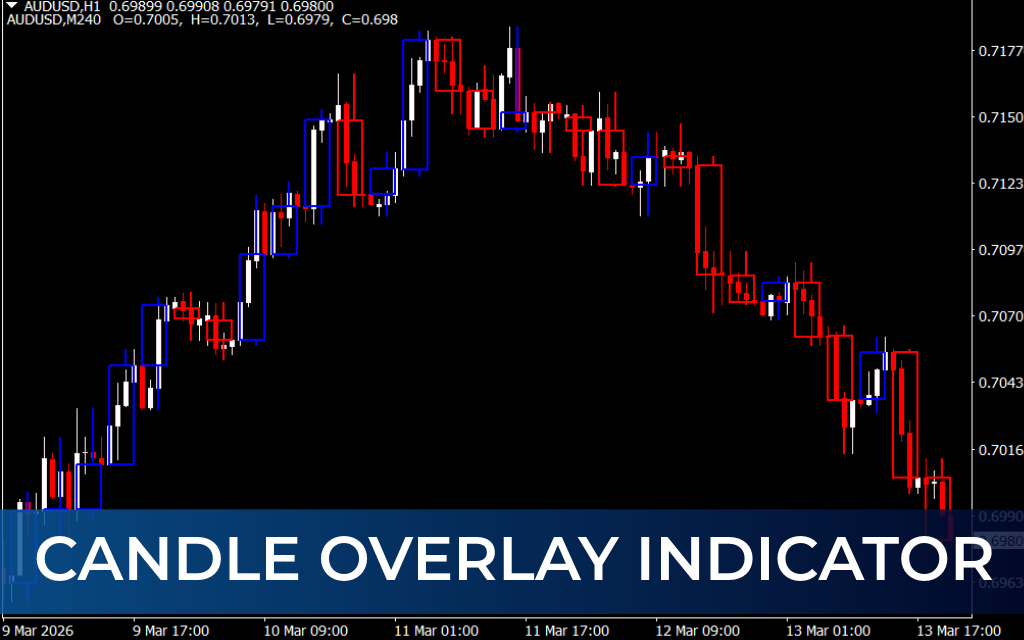
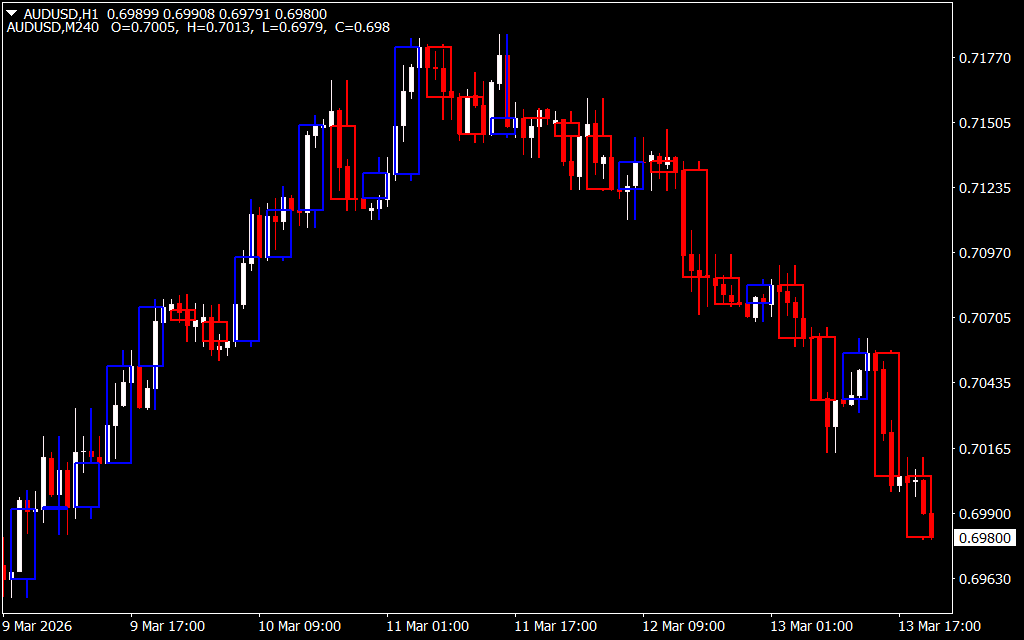
The Candle Overlay indicator for MetaTrader is a multi-timeframe charting tool that allows traders to view higher-timeframe candlesticks on a lower-timeframe chart. This makes top-down analysis easier, helping you anticipate market reactions without constantly switching between charts.
It’s ideal for Scalping, day trading, and swing trading, and benefits both novice and professional traders.
How Candle Overlay Works
- Multi-Timeframe Visualization → Displays H4 candlesticks on lower timeframes such as H1.
- Example: One H4 candle is represented by four H1 candles.
- Price Action Colors →
- Blue Candles → Bullish
- Red Candles → Bearish
- Limitations → Only works on timeframes lower than H4. It does not display D1 or higher timeframe candlesticks.
By overlaying higher timeframe candles, traders can easily spot:
- Key Support And Resistance levels
- Bullish/bearish trends from higher timeframes
- Potential turning points affecting lower timeframe trades
How to Use Candle Overlay Indicator
- Install the Indicator on your MT4 platform and attach it to a lower timeframe chart.
- Observe the higher timeframe candlesticks painted in blue and red.
- Use the information to:
- Scalpers → Monitor H4 trends while trading on M15 or M30 for more precise entries.
- Day/Swing Traders → Identify higher timeframe turning points to align with lower timeframe entries.
- Combine with other technical tools like support/resistance or trend indicators for trade confirmation.
Note: Candle Overlay does not generate buy/sell signals. It is purely an analytical tool for multi-timeframe visualization.
Advantages
✅ Simplifies multi-timeframe analysis
✅ Helps anticipate price reactions on lower timeframes
✅ Works for scalping, day trading, and swing trading
✅ Enhances top-down trading strategies
✅ Free to download
Conclusion
The Candle Overlay indicator for MT4 is a valuable tool for traders who rely on multi-timeframe analysis. It allows you to view higher timeframe price behavior on a lower timeframe chart, making trend spotting, entry timing, and market reaction anticipation much easier. While it does not provide direct signals, it complements other technical analysis tools effectively.
FAQ
4 Downloads
Published:
Mar 14, 2026 08:51 AM
Category: