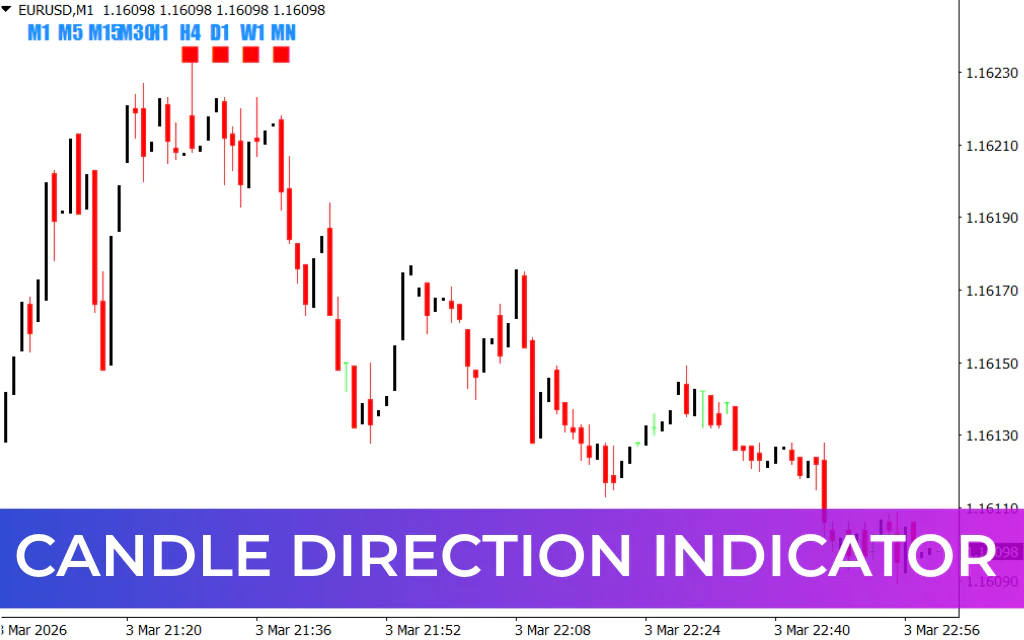
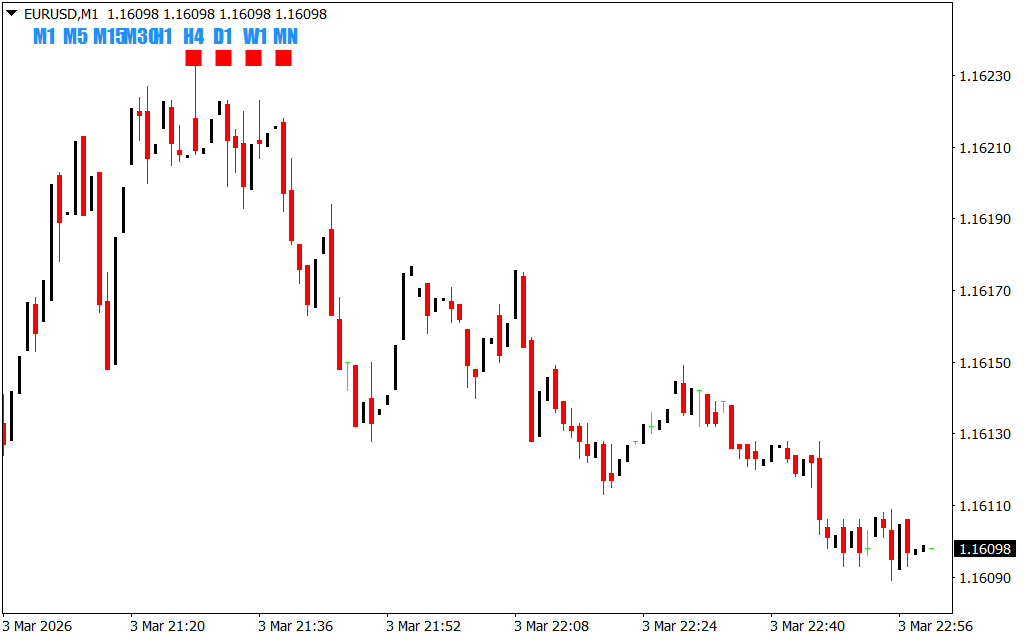
The Candle Direction Indicator for MetaTrader 4 (MT4) is a powerful multi-timeframe (MTF) tool that allows forex traders to identify candlestick directions across all chart timeframes at a glance. By color-coding the candles according to their trend direction, this indicator helps traders quickly assess market momentum and make informed trading decisions.
Whether you are a beginner or an advanced trader, the Candle Direction Indicator simplifies trend analysis by displaying the directional bias of a currency pair from intraday to monthly charts.
Key Features
- Multi-Timeframe Analysis: Displays candlestick directions from all timeframes, including M1, M5, M15, H1, H4, daily, weekly, and monthly.
- Color-Coded Candles:
- Green: Upward/bullish candle
- Red: Downward/bearish candle
- White: Neutral/no significant movement
- Visual Trend Identification: Quickly identify dominant market trends without switching between charts.
- User-Friendly Interface: Simple and intuitive for both new and experienced traders.
How the Candle Direction Indicator Works
The Candle Direction Indicator pulls candlestick data from multiple timeframes and plots the trend direction in color-coded boxes below the chart. This allows traders to see:
- Higher timeframe trends for better trade alignment
- Short-term momentum for entry timing
- Neutral zones where market indecision exists
Trading Signals:
- Buy Signal: When the majority of candles across multiple timeframes are green, indicating bullish momentum.
- Sell Signal: When the majority of candles are red, suggesting a bearish trend.
- Neutral Market: Mixed or white candles, signaling traders to wait for clearer direction.
💡 Tip: Combine the Candle Direction Indicator with support/resistance levels, moving averages, or other technical indicators for higher accuracy in entries and exits.
How to Trade Using the Candle Direction Indicator
- Place the Indicator: Add the Candle Direction Indicator to your MT4 chart.
- Analyze Candle Colors: Observe the boxes representing multiple timeframes.
- Confirm Trend Direction:
- Buy when most candles show green
- Sell when most candles show red
- Set Stop-Loss:
- Buy: Place stop-loss below the previous swing low
- Sell: Place stop-loss above the previous swing high
- Manage Positions: Exit trades when the trend direction shifts or when price reaches a predefined target.
Best Practices
- Works effectively on all timeframes, but most accurate when analyzing higher timeframes for Trend Confirmation.
- Ideal for trend-following, swing, and multi-timeframe trading strategies.
- Can be combined with oscillators or moving averages to filter false signals.
Conclusion
The Candle Direction Indicator for MT4 is an essential tool for forex traders using multi-timeframe strategies. By visually displaying candlestick directions from multiple charts, it helps traders identify trends, align with higher timeframes, and make informed trade decisions.
Download the Candle Direction Indicator for free and simplify your multi-timeframe technical analysis today.
FAQ
2 Downloads
Published:
Mar 03, 2026 17:04 PM
Category: