Free
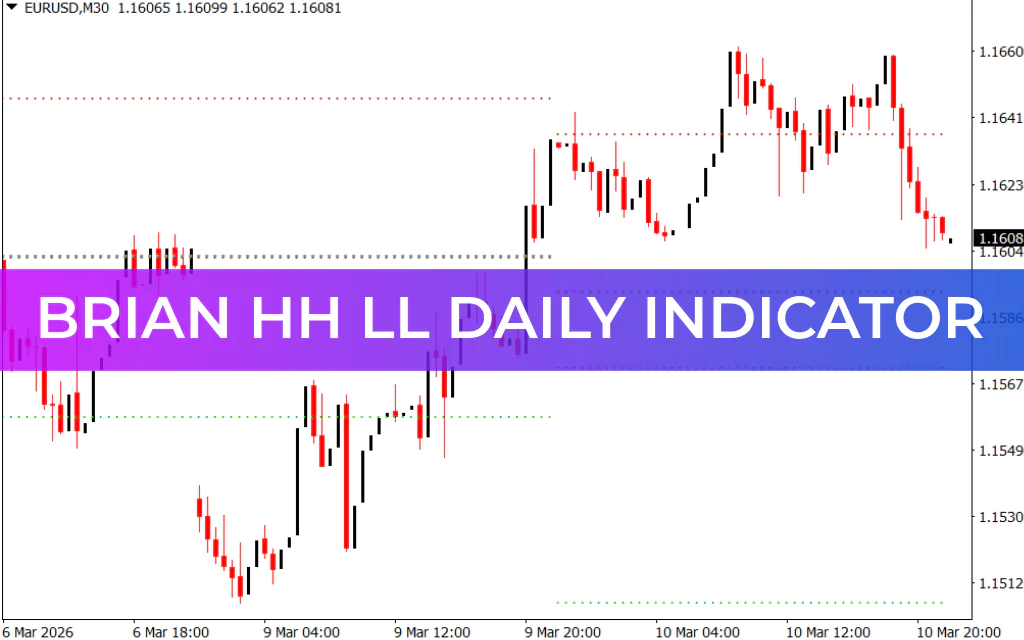
The Brian HH LL Daily Indicator is a simple yet effective pivot point indicator for MT4 that helps traders identify Support And Resistance levels based on the previous day’s high, low, and close prices. It’s ideal for spotting potential buy and sell zones.

Key Features
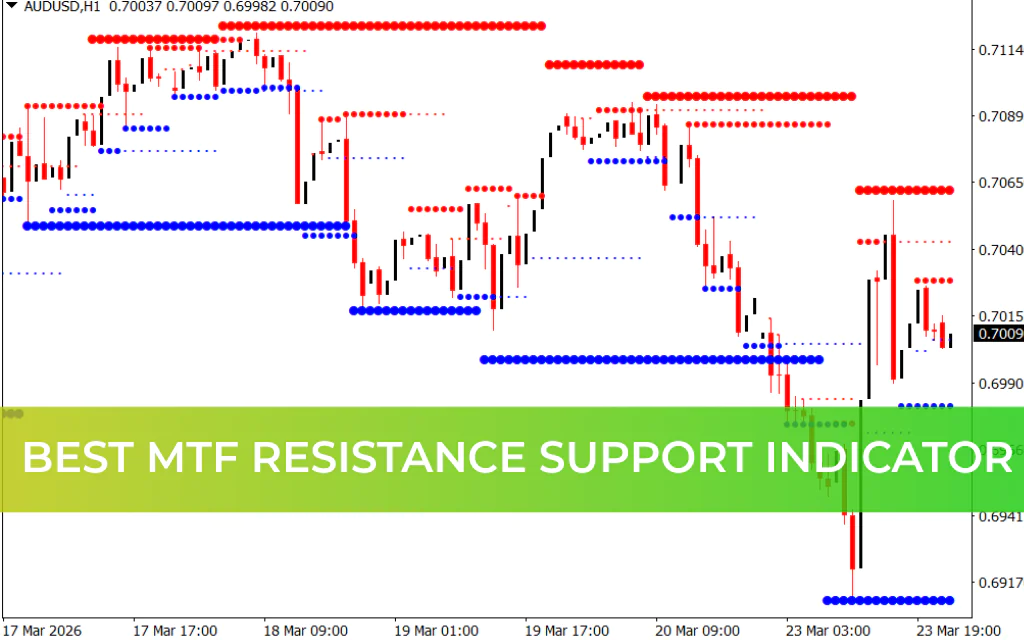
- Daily Pivot Points: Plots dots representing previous day’s high, low, and close.
- Support and Resistance: Green dots indicate support, red dots indicate resistance.
- Timeframe: Best used on the daily chart, but can be applied to shorter timeframes.
- Trade Guidance: Helps traders decide exact entry and exit points.
- User-Friendly: Suitable for novice, intermediate, and advanced traders.
How to Trade With Brian HH LL Daily Indicator
Buy Signal (Long Entry)
- Look for green dots, indicating support levels.
- Enter a BUY/long position or exit a short position.
- Confirm Price Action direction before entry to avoid false signals.
Sell Signal (Short Entry)
- Look for red dots, indicating resistance levels.
- Enter a SELL/short position or exit a long position.
- Wait for price confirmation if both red and green dots appear simultaneously.
⚠️ Note: When the indicator shows both red and green dots, it’s best to wait for price action confirmation before entering a trade.
Advantages
- Simple visualization of support and resistance levels.
- Helps in daily trading strategy by focusing on the previous day’s high, low, and close.
- Can improve timing of entry and exit points.
- Free to download and easy to install on MT4.
Conclusion
The Brian HH LL Daily Indicator is a pivot-point tool for MT4 that plots support and resistance levels from the previous day. By following the green and red dots, traders can identify potential buy and sell opportunities. It’s beginner-friendly and helps improve trading precision.
FAQ
Dots for prior day high, low, close—green support vibes, red resistance vibes.
Daily primary though shorter charts referenced—know which session pivot you are trading.
Wait for directional price confirmation before committing.
React to green dots as support with confirming bull price action.
React to red dots as resistance with confirming bear price action.
Published:
Mar 10, 2026 17:31 PM
Category:
Share: