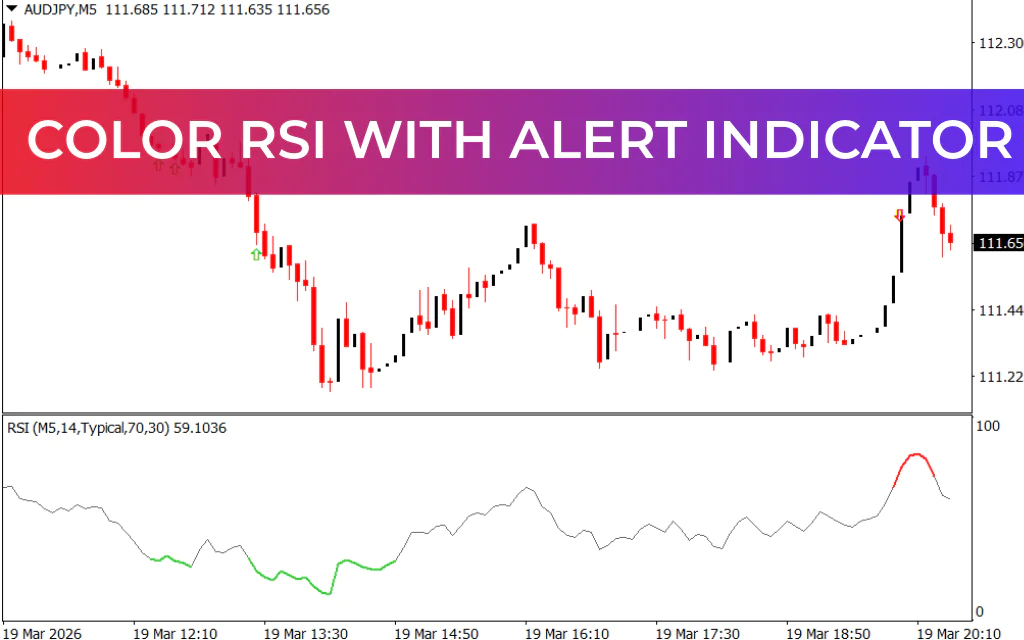
The Color RSI with Alert Indicator for MT4 is an upgraded version of the classic Relative Strength Index (RSI), designed to provide clear BUY and SELL signals, real-time alerts, and enhanced visual representation of market conditions.
By combining arrow signals, color-coded zones, and alerts, this indicator makes it easier for traders to identify overbought and oversold conditions and act quickly on potential reversals.
Key Features of Color RSI with Alert Indicator
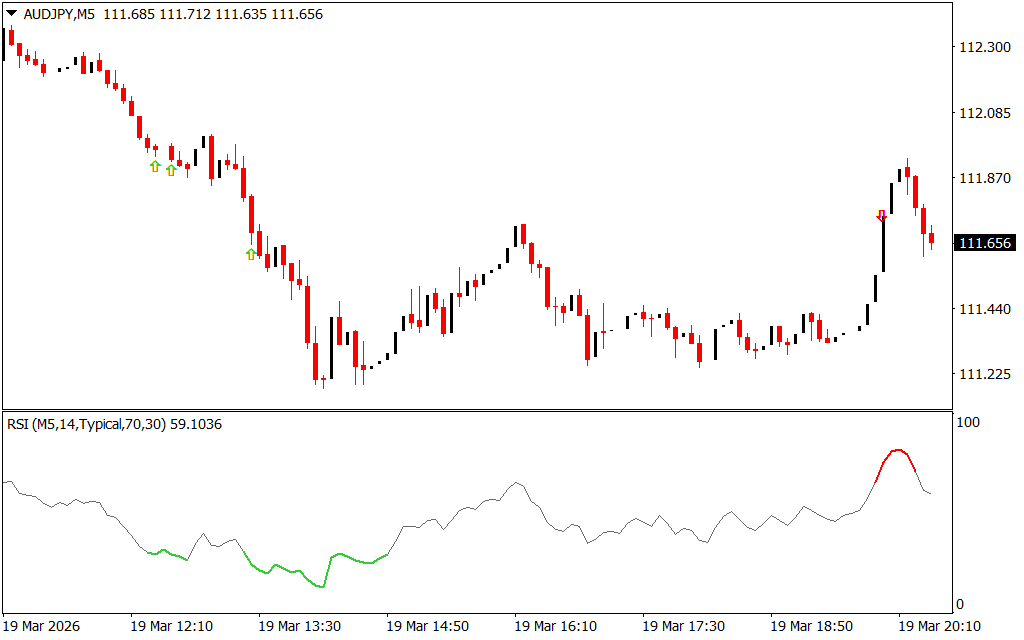
- BUY and SELL arrow signals plotted directly on the chart
- Color-coded RSI oscillator for better visualization:
- Green for oversold conditions
- Red for overbought conditions
- Gray for neutral zone
- Built-in alerts for trading opportunities
- Works on all timeframes (intraday, daily, weekly, monthly)
- Easy to install and beginner-friendly
Suitable for All Traders
The Color RSI Indicator is ideal for both beginner and advanced traders:
- Beginner traders can rely on arrow signals and alerts for quick decisions
- Advanced traders can combine RSI signals with Price Action and other indicators for improved accuracy
Its versatility also supports top-down analysis, making it useful across multiple timeframes.
How the Color RSI Indicator Works
The indicator enhances traditional RSI functionality by adding visual cues:
- RSI below 30 → Oversold zone (Green) → Potential bullish reversal
- RSI above 70 → Overbought zone (Red) → Potential bearish reversal
- Arrow signals appear on the chart to confirm entry points
This combination allows traders to quickly identify high-probability setups without complex analysis.
Trading Strategy Using Color RSI Indicator
BUY Signal (Bullish Setup)
- RSI drops below 30 (oversold zone)
- Indicator displays a Green BUY arrow
- Enter a BUY trade
- Stop Loss: Below the previous swing low
- Take Profit:
- At opposite signal, or
- Risk-reward ratio of 1:2 or higher
SELL Signal (Bearish Setup)
- RSI rises above 70 (overbought zone)
- Indicator displays a Red SELL arrow
- Enter a SELL trade
- Stop Loss: Above the previous swing high
- Take Profit:
- At opposite signal, or
- When RSI returns to neutral/oversold zone
Multi-Timeframe Trading Advantage
This indicator works effectively across all timeframes, making it ideal for top-down analysis:
- Use higher timeframes to identify the overall trend
- Use lower timeframes to pinpoint entry and exit points
This approach improves trade accuracy and timing.
Conclusion
The Color RSI with Alert Indicator for MT4 enhances the classic RSI by adding visual clarity, alerts, and actionable signals. It helps traders quickly identify reversal opportunities and execute trades with confidence. Whether you are a beginner or an experienced trader, this indicator is a valuable tool for improving your technical analysis and trading performance.
FAQ
Published:
Mar 19, 2026 15:47 PM
Category: