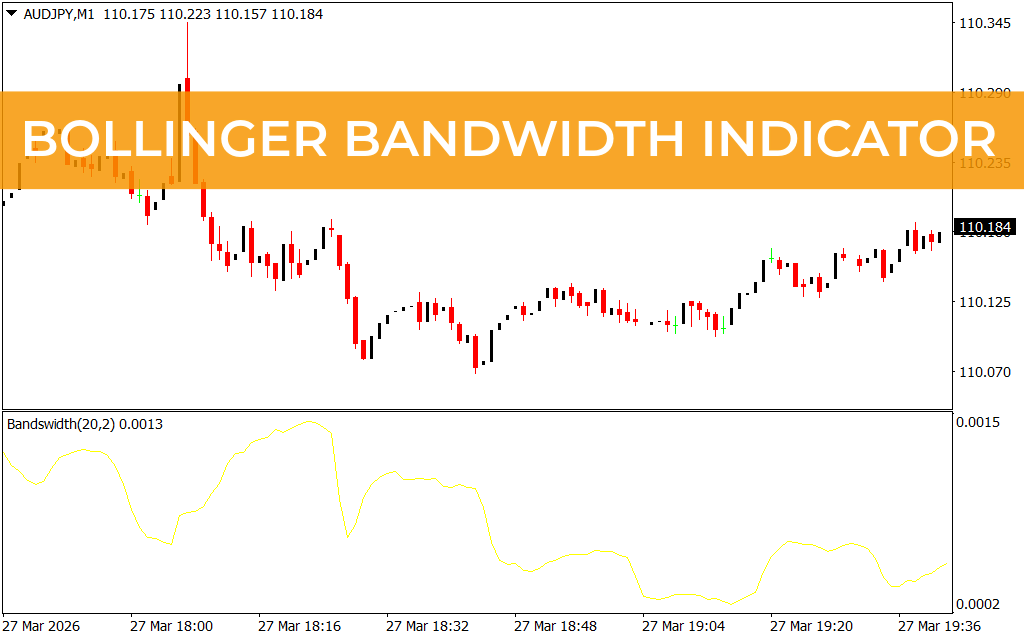
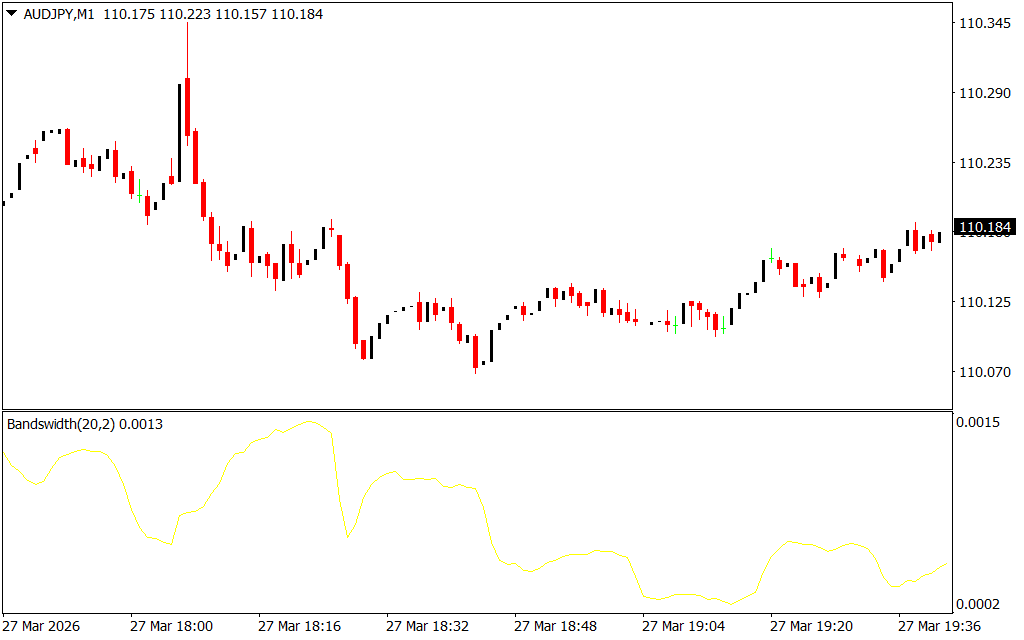
The Bollinger Bandwidth Indicator for MetaTrader 4 (MT4) is a volatility-based tool that measures the distance between the upper and lower bands of the classic Bollinger Bands. By analyzing the width of the bands, traders can anticipate periods of high or low volatility, helping them prepare for potential price movements.
What Is the Bollinger Bandwidth Indicator?
The Bollinger Bandwidth Indicator works by plotting the difference between the outer Bollinger Bands as an oscillator in a separate window:
- Increasing Values: Indicate rising volatility and larger price swings
- Decreasing Values / Flat Line: Suggest low volatility, signaling a potential upcoming market move
It is suitable for all timeframes—intraday, daily, weekly, and monthly—making it useful for both scalpers and swing traders.
How to Use the Bollinger Bandwidth Indicator in MT4
The indicator itself does not provide trend direction but signals periods when the market is likely to move. Traders can use it to plan their trades in combination with other indicators:
- Anticipate Volatility:
- Low oscillator values indicate a potential breakout
- Traders should wait for Price Action or trend confirmation before entering trades
- Pattern Recognition:
- Look for double tops or double bottoms in the oscillator
- Double top → Sell with stop loss above the top
- Double bottom → Buy with stop loss below the bottom
- Divergence Trading:
- Divergence between price and oscillator can indicate increasing or decreasing volatility
- Rising volatility often presents trading opportunities
- Trend Lines on Oscillator:
- Drawing trend lines on the bandwidth oscillator can help identify volatility shifts, even if they do not indicate market direction
Key Benefits
- Helps identify periods of low and high volatility
- Works across all timeframes for different trading strategies
- Supports Bollinger Bands users by providing a quantitative measure of volatility
- Easy to install and use for both new and advanced traders
Conclusion
The Bollinger Bandwidth Indicator for MT4 is a valuable tool for forecasting market volatility. While it does not provide trading signals or market direction on its own, it complements other technical indicators to help traders anticipate price movements. The indicator is free to download and can be quickly integrated into any MT4 setup.
FAQ
1 Download
Published:
Mar 28, 2026 19:15 PM
Category: