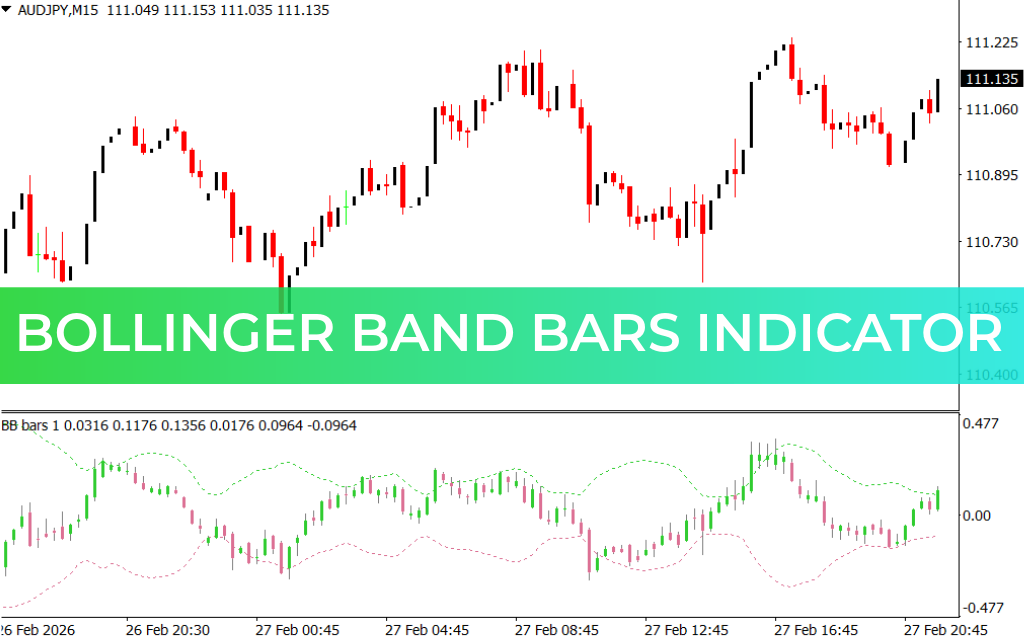
The Bollinger Band Bars Indicator for MT4 is a technical tool that plots a mini price chart with Bollinger Bands in a separate indicator window. This allows traders to analyze market volatility and trend direction while keeping the main chart free for additional technical indicators, enabling confluence-based trading strategies.
Ideal for both beginner and experienced Forex traders, this indicator works well across all intraday timeframes and can be integrated into automated trading systems.
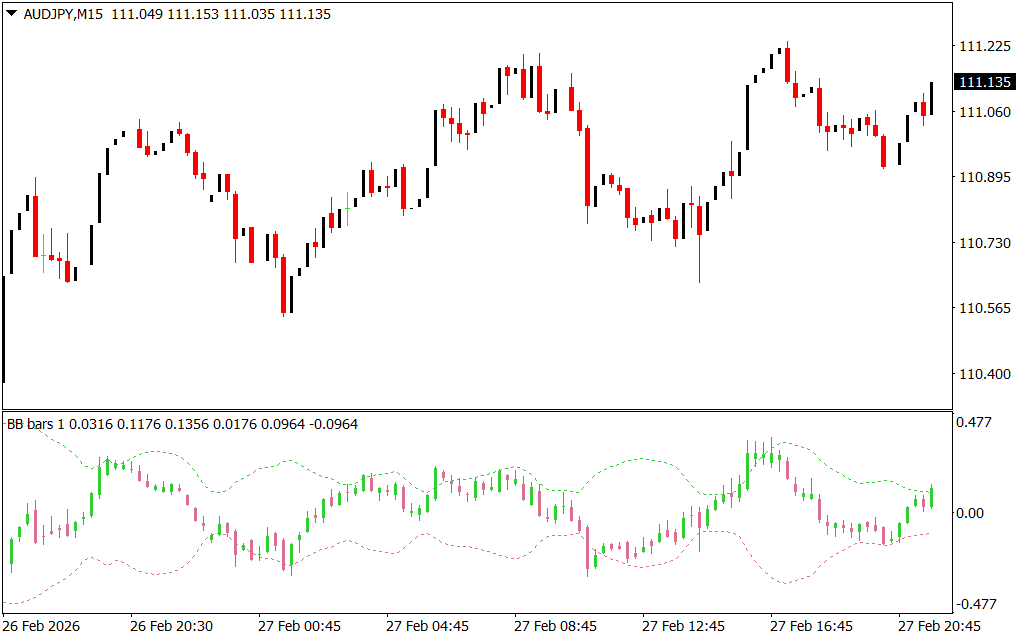
How the Bollinger Band Bars Indicator Works
The indicator plots:
- Upper Bollinger Band – Green line
- Lower Bollinger Band – Red line
- Bullish candlesticks – Green bars
- Bearish candlesticks – Red bars
These visual cues follow the standard Bollinger Bands rules:
- Bands expand during high volatility and contract (squeeze) during low volatility, signaling a potential upcoming breakout
- Prices tend to oscillate between the upper and lower bands
- A breakout above the upper band or below the lower band often signals continuation in the breakout direction
Trading Strategy Using Bollinger Band Bars
Buy Setup
- Observe prices hitting the lower band and reversing upward.
- Enter a buy trade.
- Place a stop loss below the previous swing low.
- Take profit at the opposite end of the bands or based on risk-reward ratio.
Sell Setup
- Watch for prices hitting the upper band and reversing downward.
- Enter a sell trade.
- Place a stop loss above the previous swing high.
- Set take profit near the lower band or based on your exit strategy.
For higher accuracy, traders can combine signals with other technical indicators or Price Action patterns.
Benefits of the Bollinger Band Bars Indicator
- Plots a mini Bollinger Bands chart in a separate window
- Visualizes market volatility and trend direction
- Supports all intraday timeframes
- Integrates easily with other indicators for confluence strategies
- Suitable for manual and automated Forex trading
Conclusion
The Bollinger Band Bars Indicator for MT4 is an effective tool for visualizing volatility and price action in a mini chart format. By monitoring the upper and lower bands along with bullish and bearish bars, traders can identify high-probability trading opportunities while keeping their main chart free for additional analysis.
FAQ
Published:
Mar 01, 2026 07:10 AM
Category: