The Flat Market Indicator for MetaTrader 4 is a specialized tool designed to help traders detect sideways or low-volatility market conditions. Many traders enter positions during choppy Price Action, often leading to false breakouts or minimal profits. This indicator solves that problem by visually highlighting flat market phases, enabling traders to wait for stronger trends before taking action. It’s suitable for forex, stocks, commodities, and other markets.
How It Works
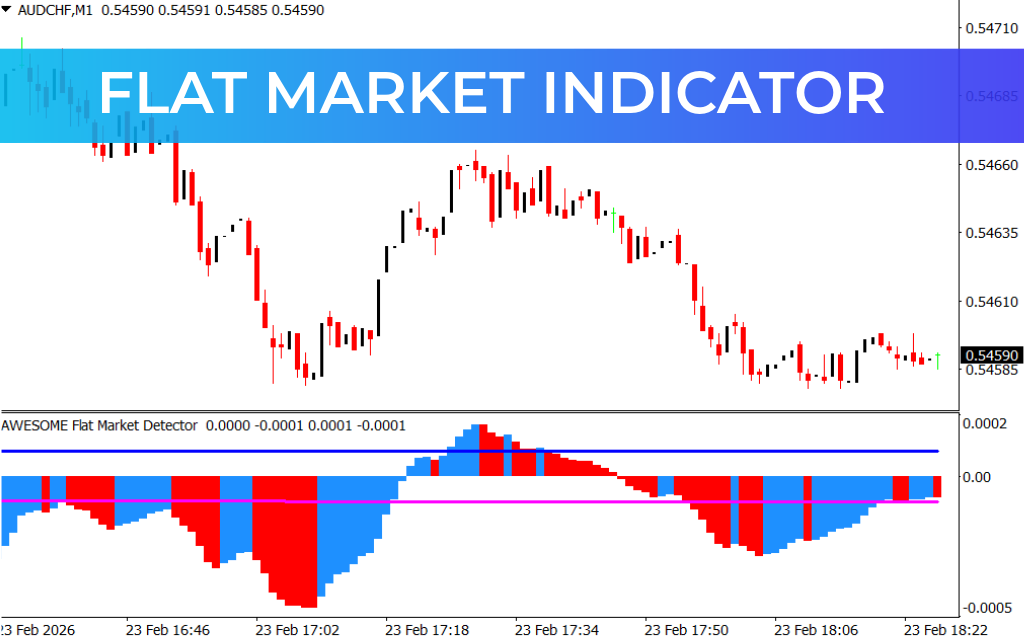
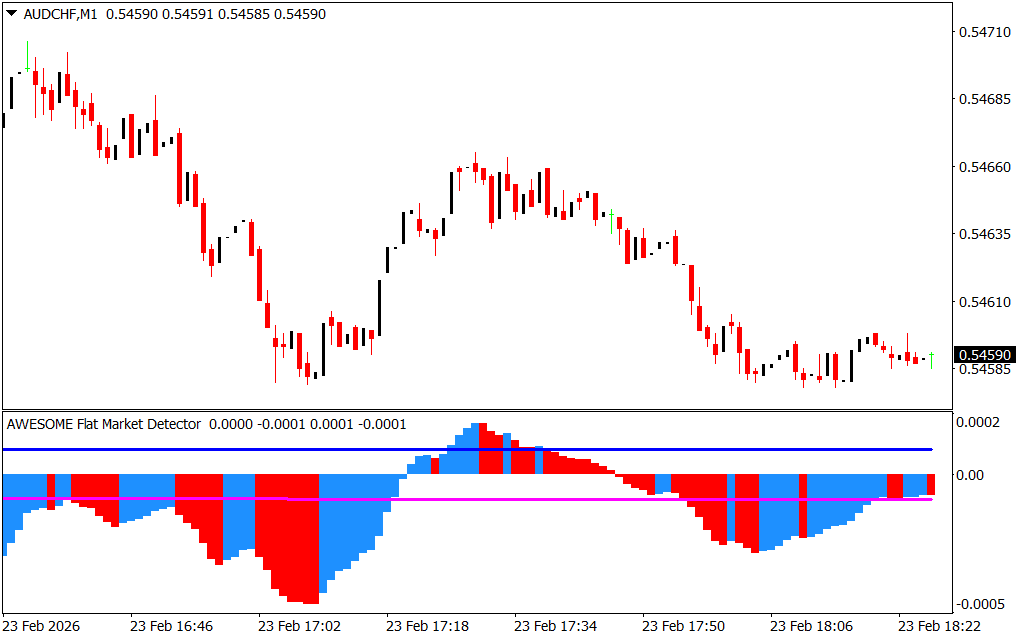
The Flat Market Indicator does not produce direct buy or sell signals. Instead, it focuses on market condition visualization:
- Flat Market – When the histogram stays near the zero line and bars are shaded neutral (gray/neutral color), it indicates low momentum. Traders are advised to avoid opening positions during these periods unless employing a range-trading strategy.
- Trending Market Transition – When histogram bars deviate strongly from zero and turn blue (bullish) or red (bearish), it signals that momentum is building and a potential trend is forming.
This approach helps traders filter out noise, avoid low-probability trades, and identify high-confidence entry points when the market gains directional strength.
Trading Signals
- Neutral Bars – Flat market; avoid new positions.
- Blue Bars – Bullish momentum emerging; potential long trade opportunity.
- Red Bars – Bearish momentum emerging; potential short trade opportunity.
By using the Flat Market Indicator alongside trend-following or breakout strategies, traders can optimize entries and reduce false signals.
Key Benefits
- Detects low-volatility and sideways market conditions
- Helps avoid trading during choppy or uncertain periods
- Provides early visual cues for trending market transitions
- Works across multiple timeframes and assets
- Complements both trend-following and range-trading strategies
Conclusion
The Flat Market Indicator for MT4 is an essential tool for traders seeking to avoid unnecessary trades in low-momentum markets. By clearly identifying flat periods and signaling potential trend transitions, it enhances trade timing, reduces losses, and improves overall strategy effectiveness.
Whether you’re a beginner or an experienced trader, this indicator helps you trade smarter by waiting for high-probability setups.
FAQ
Published:
Feb 23, 2026 12:28 PM
Category: