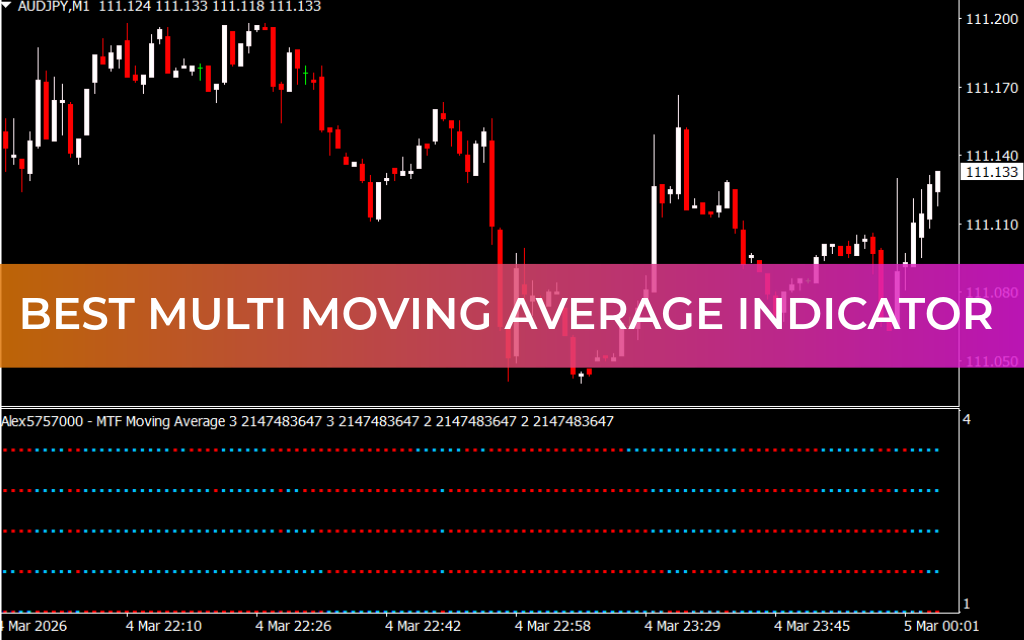
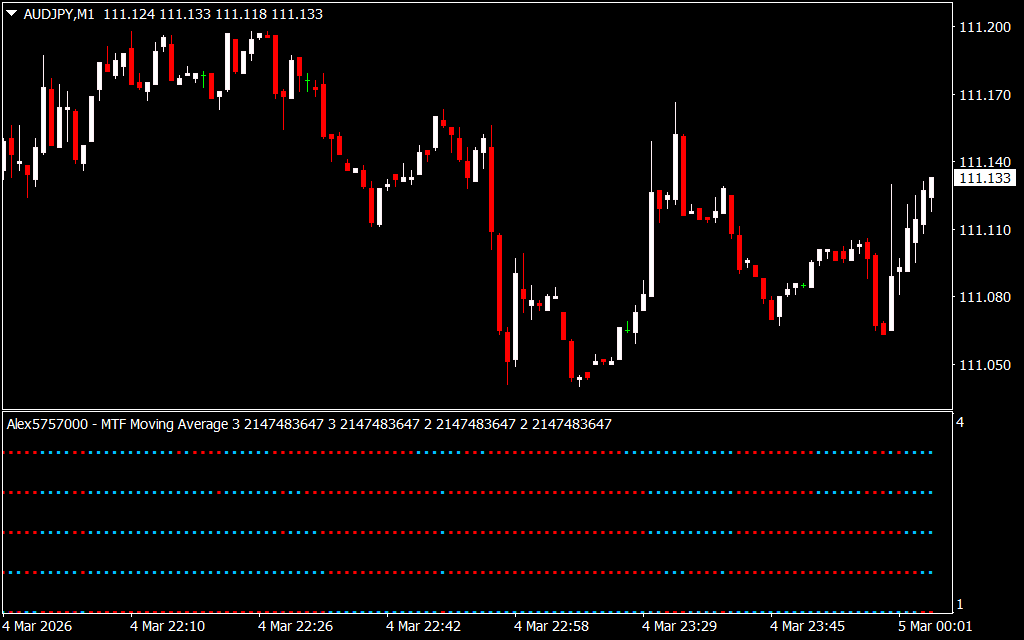
he Multi Moving Average Indicator for MT4 is a powerful trend-following tool that uses multiple exponential moving averages (EMA) to determine the correct market direction. By combining different EMAs, traders can identify short- and long-term trends, improve signal accuracy, and enhance trading decisions in forex and stock markets.
This indicator works across all MT4 timeframes, making it ideal for Scalping, intraday, and day trading strategies.
How the Multi Moving Average Indicator Works
The Best Multi Moving Average Indicator applies four EMAs with the following periods:
- 13 EMA – short-term trend
- 34 EMA – short-term to medium-term trend
- 55 EMA – medium-term trend
- 89 EMA – long-term trend
Trend Signals
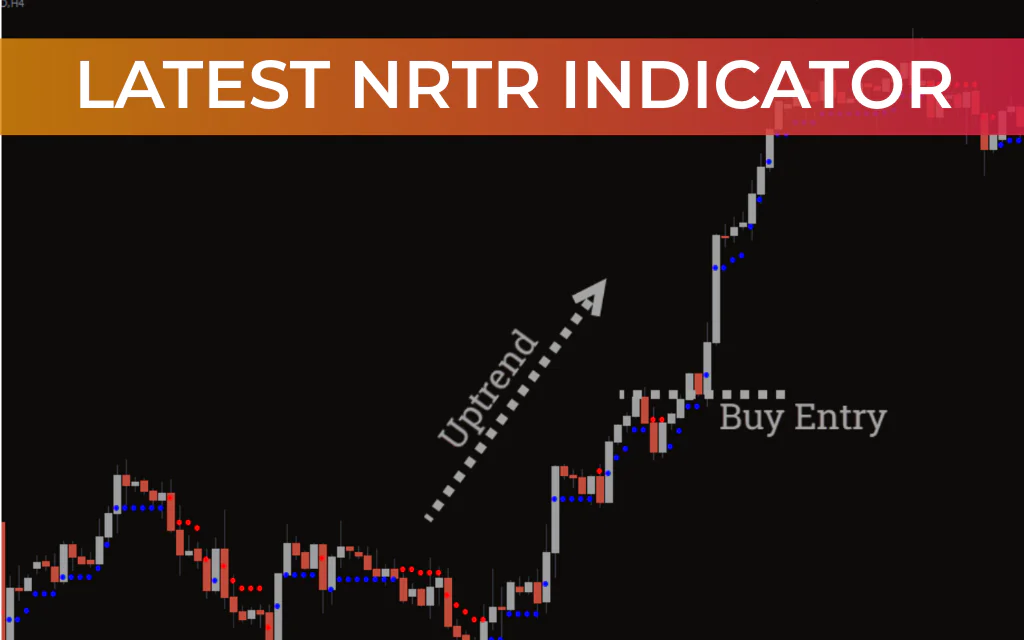
- Blue Dots – bullish trend signal
- Red Dots – bearish trend signal
The combination of these EMAs allows traders to confirm both the overall market trend and the short-term momentum before entering trades.
How to Trade With the Multi Moving Average Indicator
Long (Buy) Setup
- Confirm a long-term bullish trend by checking the 55 EMA and 89 EMA (bottom EMAs) are blue.
- Wait for the short-term EMAs (13 & 34) to turn blue, confirming entry timing.
- Enter a buy position aligned with both long- and short-term momentum.
- Consider exiting the trade when all EMA dots turn red, signaling Trend Reversal.
Short (Sell) Setup
- Confirm a long-term bearish trend by checking the 55 EMA and 89 EMA (bottom EMAs) are red.
- Wait for the short-term EMAs (13 & 34) to turn red, confirming entry.
- Enter a sell position aligned with both long- and short-term momentum.
- Consider exiting the trade once all EMA dots turn blue.
Key Benefits
- Identifies dominant trend direction
- Confirms short- and long-term market momentum
- Helps determine dynamic Support And Resistance levels
- Validates range breakouts
- Suitable for scalping, intraday, and day trading
Example Scenario
On a GBP/USD H4 chart:
- The 55 EMA and 89 EMA were blue, signaling a long-term bullish trend.
- Once the 13 EMA and 34 EMA turned blue, it confirmed short-term momentum.
- Entering a buy trade at this point aligned with the overall market trend.
- Exiting the trade was recommended when all EMAs started turning red.
Conclusion
The Multi Moving Average MT4 Indicator is an essential trend-following tool for forex and stock traders. By combining multiple EMA periods, it provides a reliable method for confirming market direction, spotting trade entries/exits, and enhancing the overall success rate of trend-based strategies.
FAQ
1 Download
Published:
Mar 04, 2026 18:07 PM
Category: