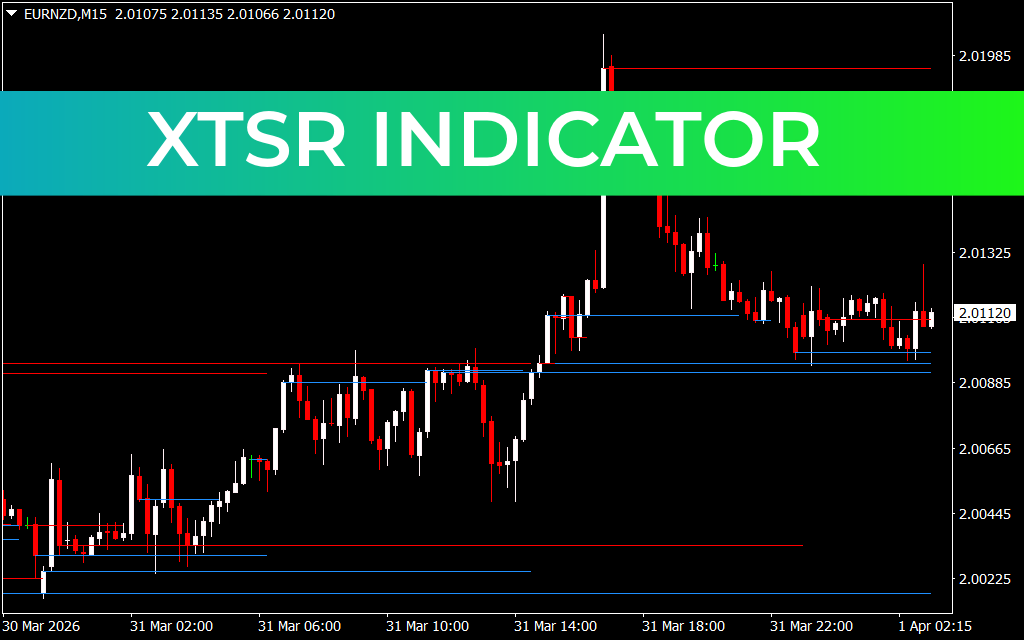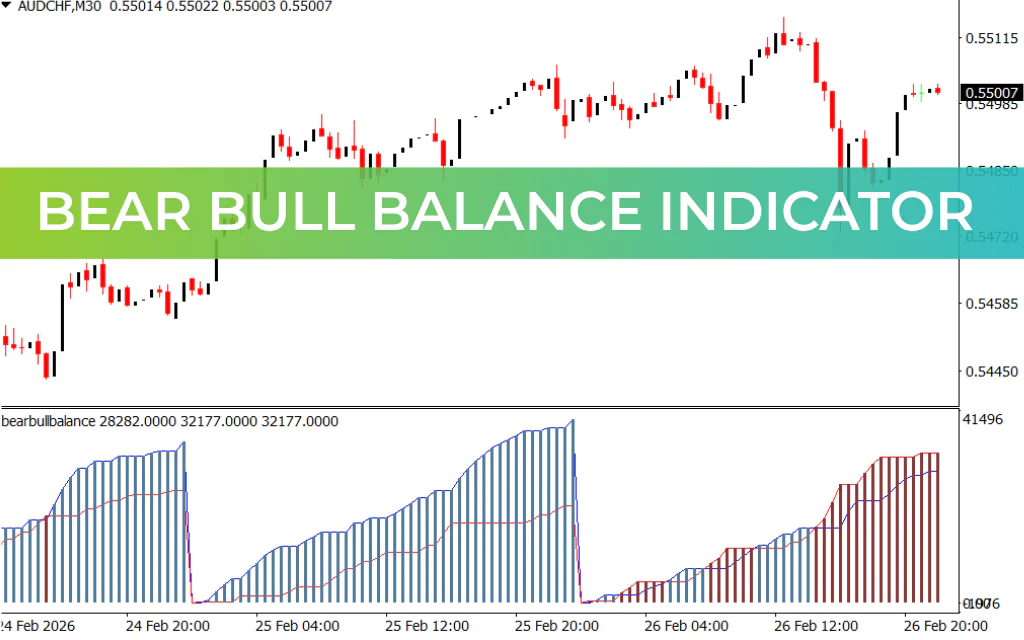
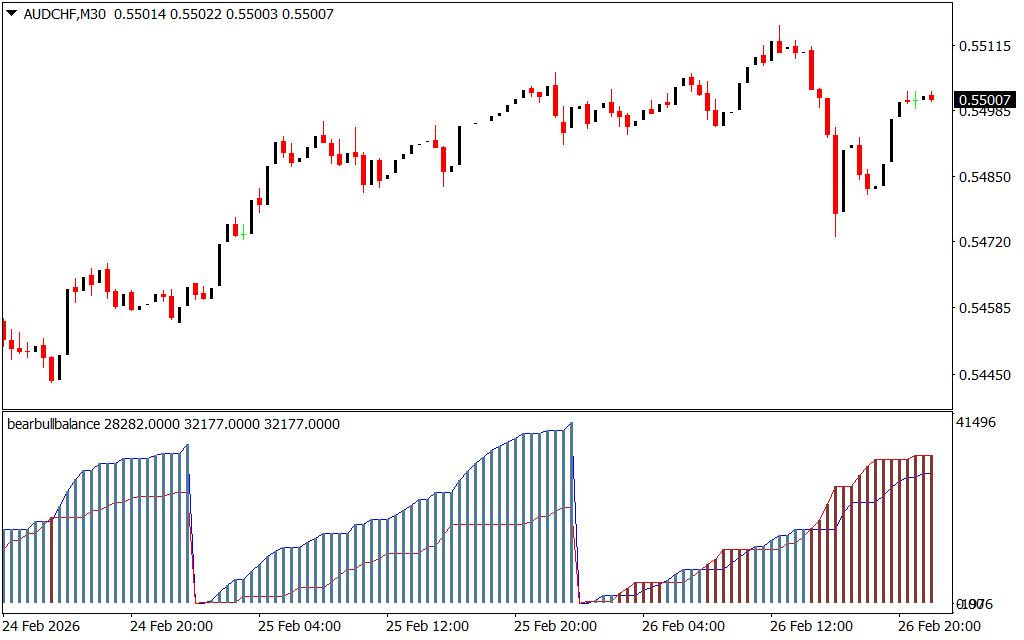
The Bear Bull Balance indicator for MT4 is a market sentiment and trend tool that measures the relative strength of bulls and bears to provide bullish and bearish trading signals. It uses bulls power and bears power crossovers to generate signals and plots this information visually as a histogram, allowing traders to quickly assess market dominance and direction.
This indicator is suitable for new and advanced forex traders and works on all intraday charts as well as daily, weekly, and monthly timeframes. It can also be integrated into automated trading strategies.
How It Works
- Blue line: Bulls power
- Red line: Bears power
- Histogram bars:
- Gray: Bulls in control (bullish trend)
- Red: Bears in control (bearish trend)
- Signal generation:
- When the blue line crosses above the red line, the histogram turns gray, indicating a bullish trend.
- When the red line crosses above the blue line, the histogram turns red, indicating a bearish trend.
Trading Strategy
- Observe the histogram color change.
- Enter trades based on the signal:
- Buy Trade: Histogram turns gray → Enter buy with stop loss below previous swing low.
- Sell Trade: Histogram turns red → Enter sell with stop loss above previous swing high.
- Exit positions when the histogram signals the opposite trend.
- Use with proper risk management to maximize gains and limit losses.
Benefits and Features
✔ Shows market dominance between bulls and bears
✔ Clear visual signals via histogram and lines
✔ Works on all timeframes from M1 to monthly
✔ Suitable for Scalping, intraday, and long-term strategies
✔ Can be used in automated trading systems
✔ Easy to interpret for both new and experienced traders
Conclusion
The Bear Bull Balance indicator for MT4 is a reliable forex trading tool for assessing the strength of market participants. By using bull and bear power crossovers and histogram visualization, traders can enter and exit trades with confidence based on market momentum.
FAQ
Published:
Feb 26, 2026 16:28 PM
Category: