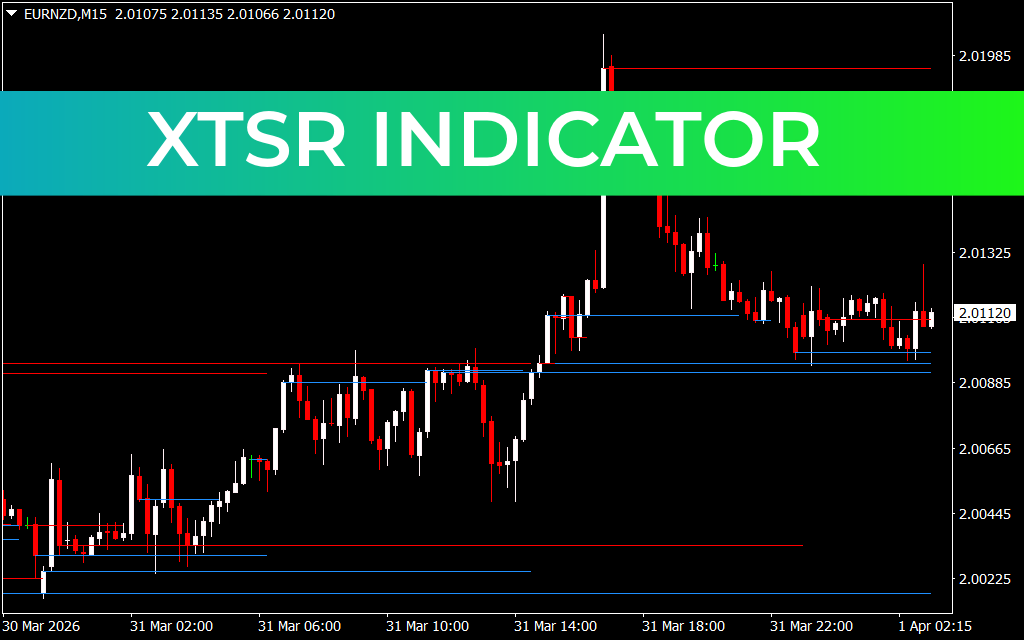
Support And Resistance levels are key concepts in trading, but identifying them by eye can be subjective. The XTSR Indicator for MT4 provides an objective method to spot these critical price levels, reducing bias in your chart analysis.
With the XTSR indicator:
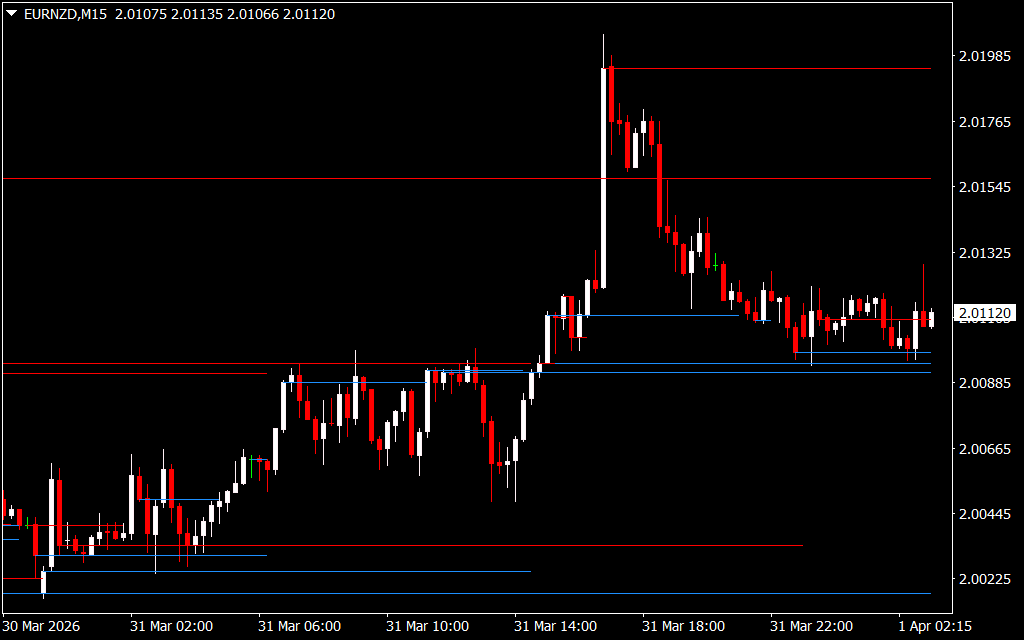
- Red lines mark important resistance levels.
- Blue lines indicate vital support levels.
- Helps traders validate price reaction zones for better entry and exit decisions.
How to Trade Using the XTSR Indicator
The XTSR works best when combined with other technical tools like Fibonacci retracement or oscillators.
Bullish / Buy Signal:
- Enter a trade when a candlestick breaks above a key resistance level.
- Optionally, wait for a pullback near the 38.2% or 50.0% Fibonacci retracement level for a safer entry.
- Hold the position until the next resistance level is reached.
Bearish / Sell Signal:
- Enter a trade when a candlestick breaks below a key support level.
- Optionally, wait for a pullback near the 38.2% or 50.0% Fibonacci retracement level for a safer entry.
- Hold the position until the next support level is reached.
Conclusion
The XTSR Indicator for MT4 helps traders objectively identify support and resistance lines, minimizing subjective errors when analyzing charts. While the indicator provides strong signals for potential price bounces, it is most effective when used alongside other technical indicators or fundamental analysis.
The XTSR indicator is free to download and easy to install on MT4.
Meta Description
Published:
Mar 31, 2026 21:21 PM
Category: