Free
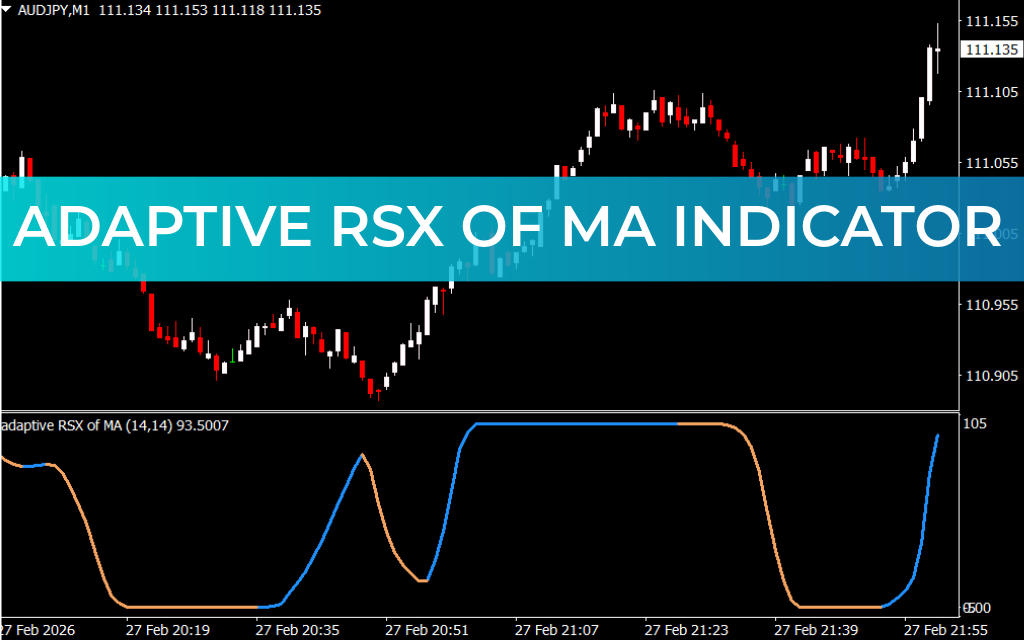
The Adaptive RSX of MA indicator for MetaTrader 4 (MT4) is an advanced trend analysis tool designed for forex day traders. It combines the Relative Strength Index (RSI) with the Moving Average (MA) to generate short-term trend-following signals.
By integrating these two indicators, it produces smoother and more accurate buy/sell signals than using RSI or MA alone.
How the Adaptive RSX of MA Works
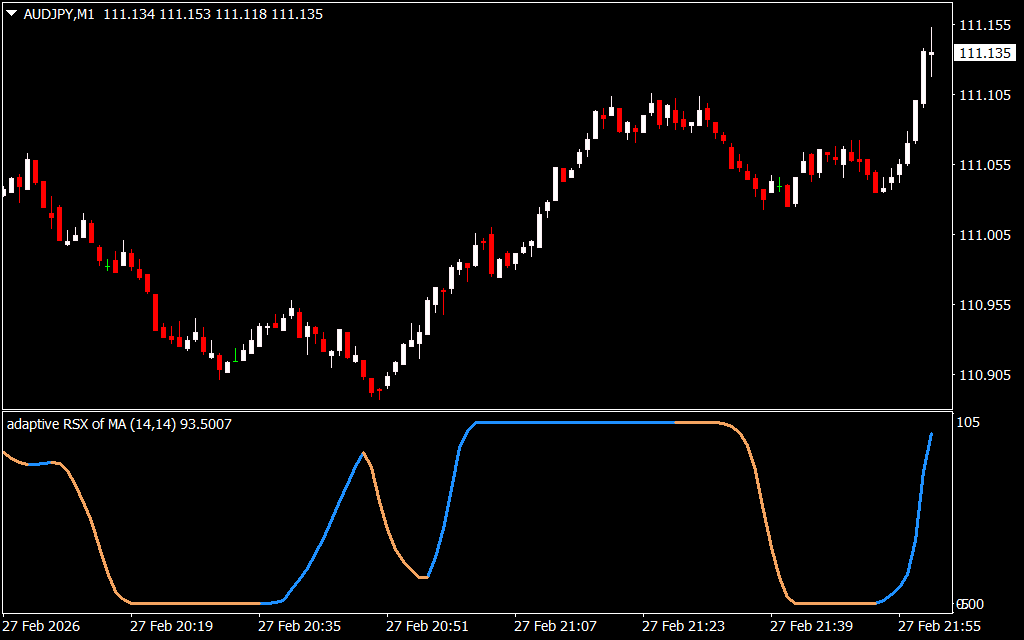
Trend Signals via Color Line
- Blue Line: Signals a bullish trend, suggesting a potential buy opportunity
- Brown Line: Signals a bearish trend, suggesting a potential sell opportunity
Trading Strategy
- Trend Confirmation:
- Combine the indicator with a trendline or support/resistance levels to confirm the trend
- For example, if price remains above a trendline and the Adaptive RSX of MA line turns blue, it confirms a bullish setup
- Entry Signals:
- Enter a buy trade when the line turns blue in an uptrend
- Enter a sell trade when the line turns brown in a downtrend
- Exit Strategy:
- Close positions when the indicator line changes color, signaling a potential Trend Reversal
- Stop loss placement should follow previous swing highs/lows for risk management
Key Features
- Combination of RSI and MA: Reduces noise and improves signal accuracy
- Color-coded trend line: Easy visual cue for buy and sell signals
- Applicable across timeframes: Works well for intraday/day trading setups
- Suitable for trend-based strategies, either manual or automated
Best Practices
- Use alongside trendlines, support/resistance, or other technical indicators to confirm signals
- Align trades with the higher time frame trend for more reliable setups
- Incorporate proper risk management to protect against reversals
Conclusion
The Adaptive RSX of MA indicator for MT4 is a powerful trend-following tool for day traders. By combining RSI and MA, it delivers accurate color-coded trend signals, making it easier to spot profitable buy and sell opportunities. When used with trendlines and proper risk management, it can significantly improve trading decision-making.
FAQ
It combines RSI with Moving Average to generate short-term trend-following signals. Produces smoother and more accurate buy/sell signals than using RSI or MA alone. Blue line = bullish trend, buy opportunity. Brown line = bearish trend, sell opportunity.
Combine with a trendline or support/resistance levels. For example, if price remains above a trendline and the line turns blue, it confirms a bullish setup.
Enter buy when the line turns blue in an uptrend. Enter sell when the line turns brown in a downtrend. Close positions when the indicator line changes color. Place stop loss at previous swing highs/lows.
Forex day traders. Advanced trend analysis. Short-term trend-following.
Reduces noise. Improves signal accuracy. Better than either indicator alone.
1 Download
Published:
Mar 01, 2026 17:33 PM
Category:
Share: