The Commodity Channel Index (CCI) Divergence Indicator is a powerful tool for technical analysis that identifies hidden divergences between price and the CCI oscillator. Divergences often signal potential trend reversals, offering high-probability entry points for traders. While any trader can use this indicator, it is particularly suited for those focusing on divergence and reversal trading strategies.
How the CCI Divergence Indicator Works
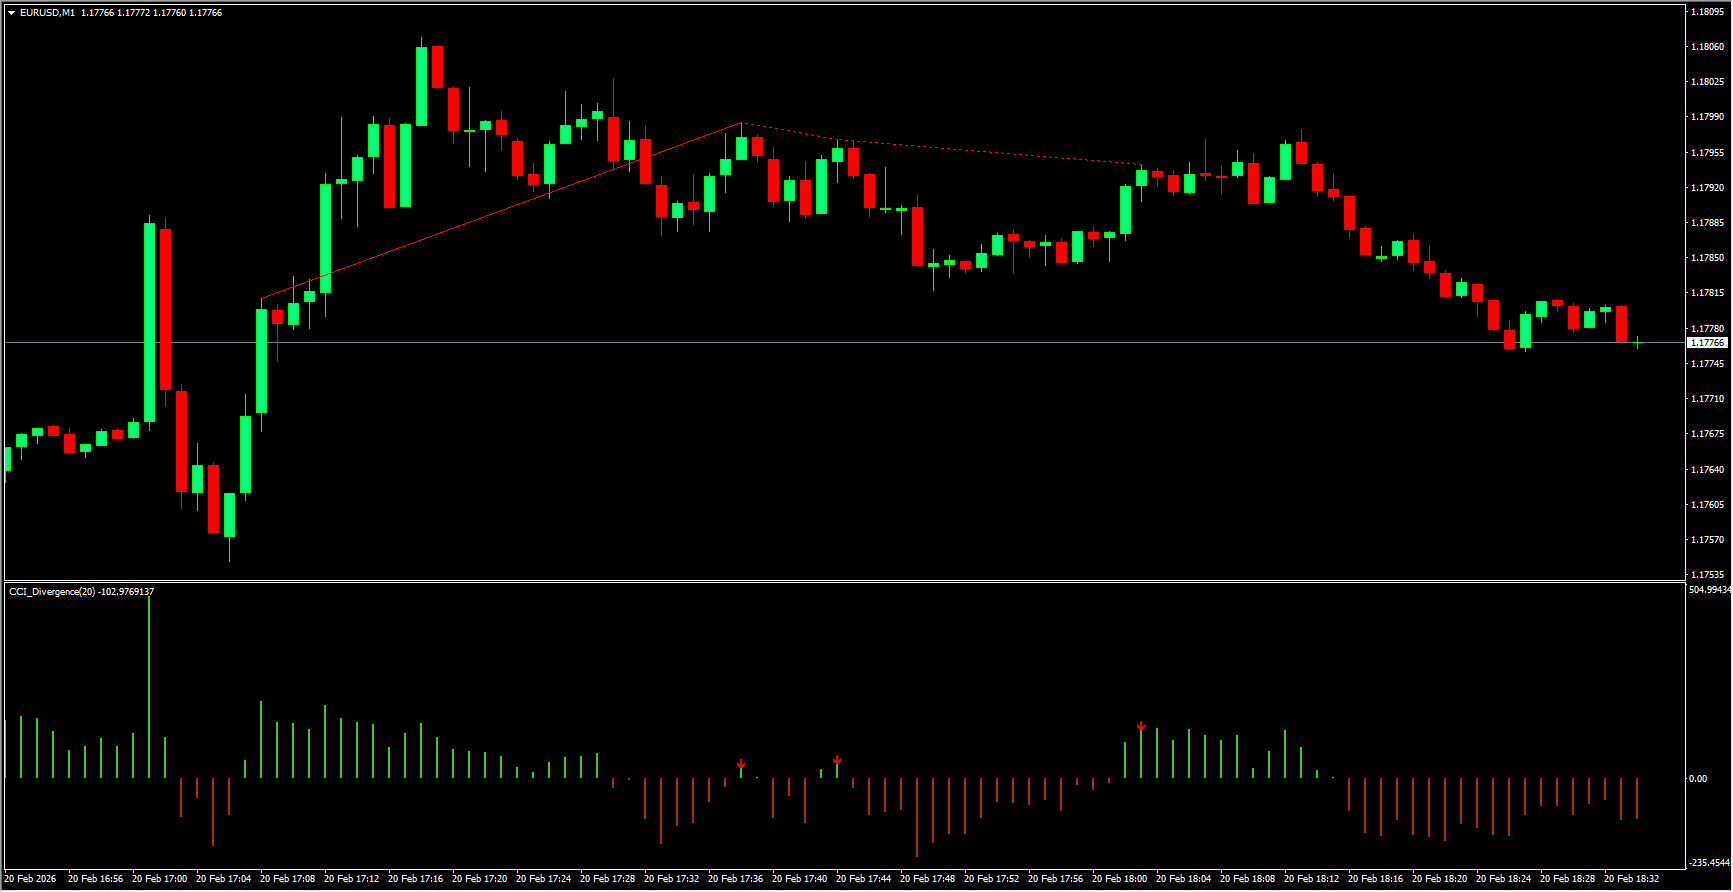
The indicator compares the price chart with the CCI pivot values and connects peaks and troughs to detect divergence:
Hidden Bullish Divergence: Price forms higher lows while the CCI forms lower lows.
Hidden Bearish Divergence: Price forms lower highs while the CCI forms higher highs.
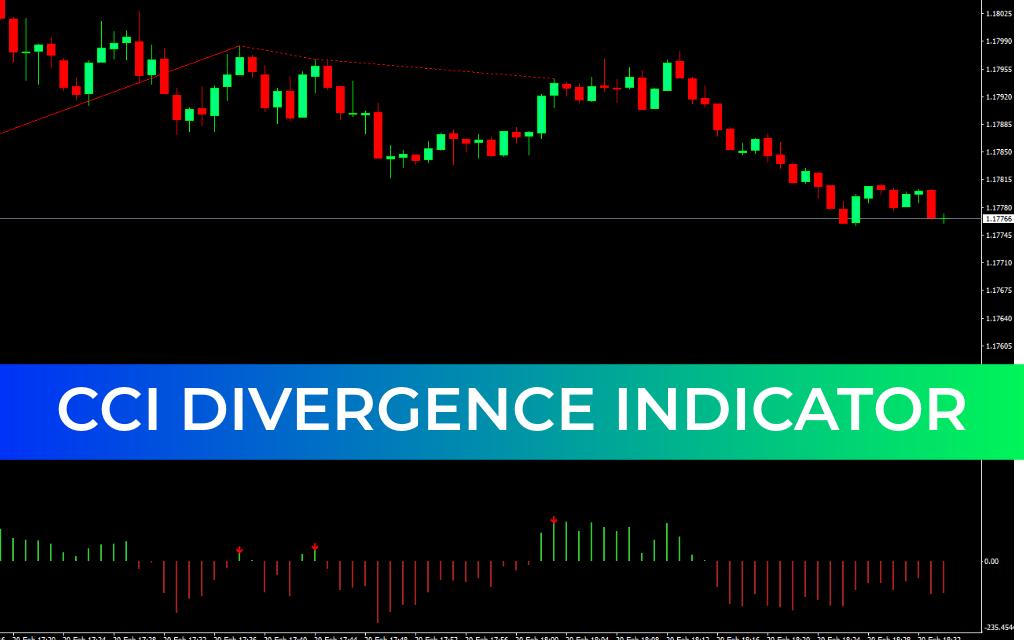
The indicator visually represents divergence using histogram bars:
Green bars (+1): Bullish divergence, indicating potential upward momentum.
Red bars (-1): Bearish divergence, indicating potential downward momentum.
Zero bars (0): No divergence detected.
It also highlights entry, exit, and stop-loss levels, helping traders plan trades with greater precision.
Trading Strategies
Long (Buy) Position
Enter when a green arrow appears on the chart, signaling a bullish divergence.
Short (Sell) Position
Enter when a red arrow appears, signaling a bearish divergence.
For example, on a daily GBP/CAD chart, green arrows mark points where a bear trend may reverse upward, while red arrows mark potential reversals of an uptrend.
Benefits of the CCI Divergence Indicator
Detects divergence across all timeframes, making it suitable for beginners and advanced traders.
Works on any instrument and allows customization of colors, backgrounds, candles, volume, and stop levels.
Highlights highest probability trade setups, helping traders focus on quality signals.
Best applied on H1, H4, and higher timeframes for reliable signals. On very short timeframes (M1, M5), signals may be too frequent or late.
Conclusion
The CCI Divergence Indicator is a robust tool for spotting trend reversals and planning high-probability trades. While extremely useful, it is best combined with other indicators, Price Action analysis, and proper risk management, including the use of stop-loss orders. No single indicator guarantees perfect signals, so thorough analysis is essential to optimize trading outcomes.
FAQ
2 Downloads
Published:
Feb 20, 2026 11:37 AM
Category: