The XTC Trend Indicator for MT4 is a versatile oscillator that uses colored histogram bars to identify bullish and bearish market trends. Designed for forex trend traders, it combines multiple technical indicators to deliver accurate trend direction and potential Trend Reversal signals.
Key Features of XTC Trend Indicator
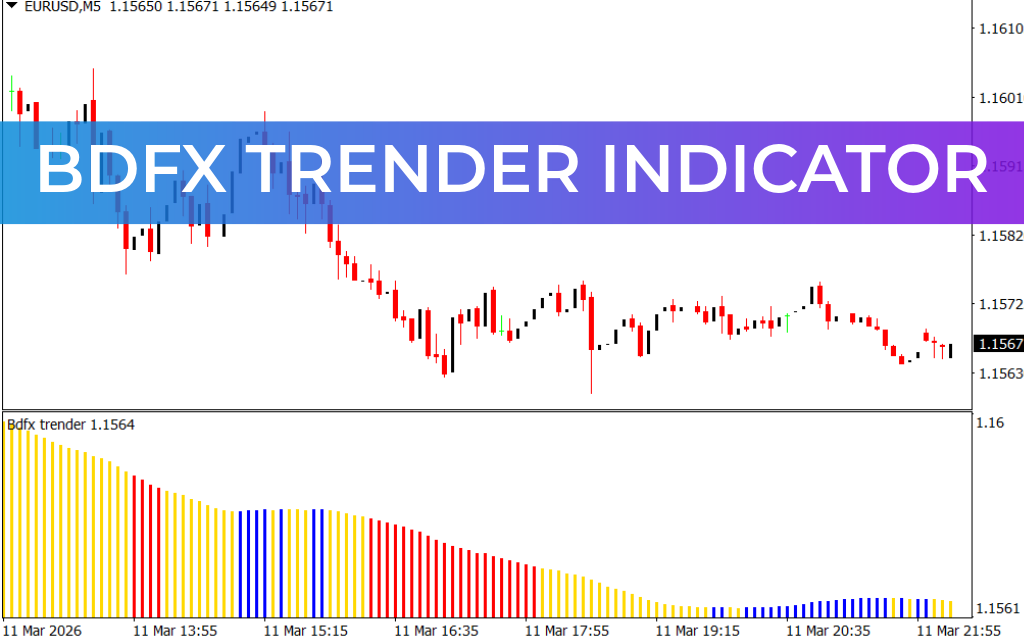
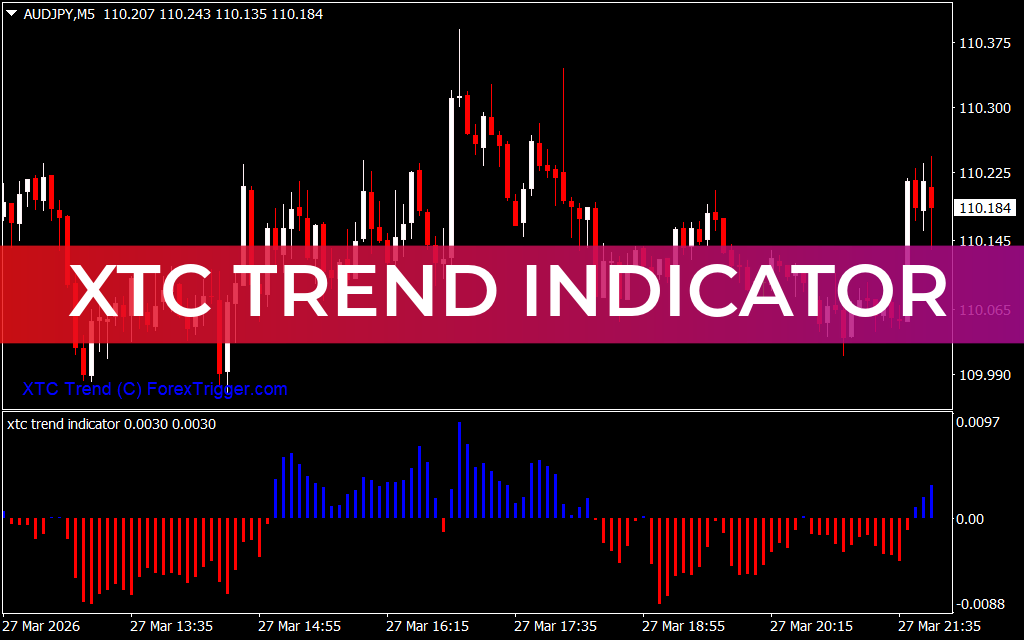
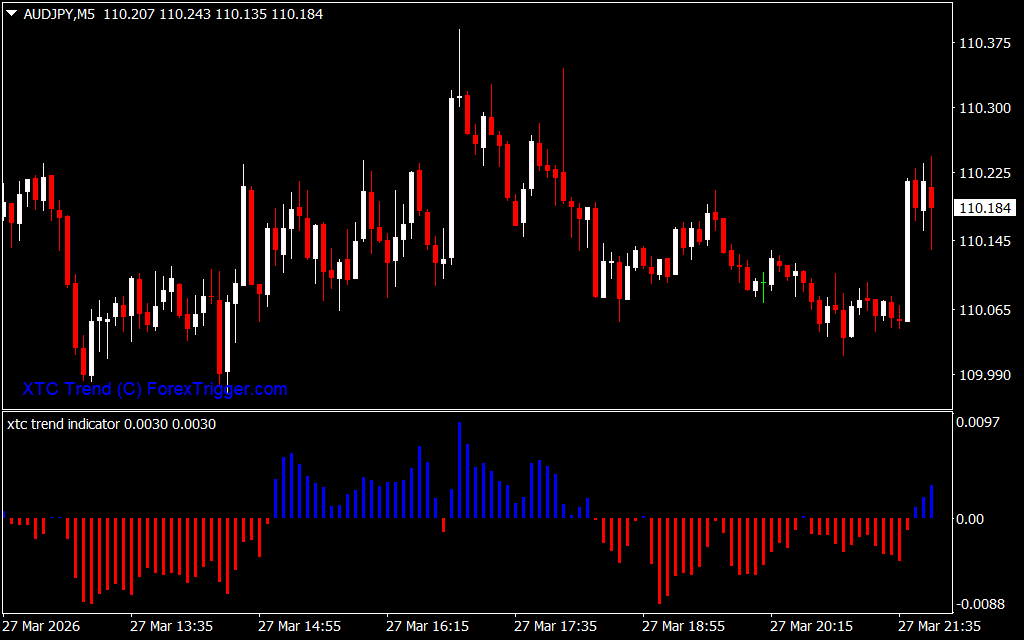
- Visual Trend Signals: Blue bars above zero indicate bullish trends, while red bars below zero indicate bearish trends.
- Multi-Timeframe Use: Works on intraday, daily, weekly, and monthly charts.
- Trend Reversals: Helps identify not only the current trend but also potential reversals.
- Auto Trading Compatible: Suitable for automated trading strategies.
How to Trade with XTC Trend Indicator
The indicator generates trade signals based on histogram color changes:
- Buy Signal: When histogram bars turn blue above the zero line, it indicates bullish momentum. Enter a buy trade and place a stop loss below the previous swing low.
- Sell Signal: When histogram bars turn red below the zero line, it signals bearish momentum. Enter a sell trade and place a stop loss above the previous swing high.
- Exit Strategy: Since no profit target is provided, exit trades using a favorable risk-reward ratio or when the histogram changes color.
For higher accuracy, traders can combine the histogram signals with the higher timeframe trend direction to reduce false signals and stay aligned with the dominant market trend.
Why Traders Use XTC Trend Indicator
The XTC Trend Indicator is ideal for forex trend traders seeking a clean, clutter-free chart. Its visual signals simplify trading decisions while supporting both manual and automated strategies.
Conclusion
In summary, the XTC Trend Indicator for MT4 helps traders quickly identify bullish and bearish trends and potential reversals. Its simplicity and multi-timeframe compatibility make it a valuable tool for trend-following strategies.
FAQ
1 Download
Published:
Mar 27, 2026 19:27 PM
Category: