The RSI TMA Centered Bands Indicator for MT4 combines the classic Relative Strength Index (RSI) with a Triangular Moving Average (TMA) to help Forex traders identify trend direction, overbought and oversold conditions, and optimal entry points. By plotting the TMA around the RSI in a separate indicator window, traders can better gauge market momentum and potential reversals.
This indicator works well on all chart timeframes and is suitable for both new and advanced traders.
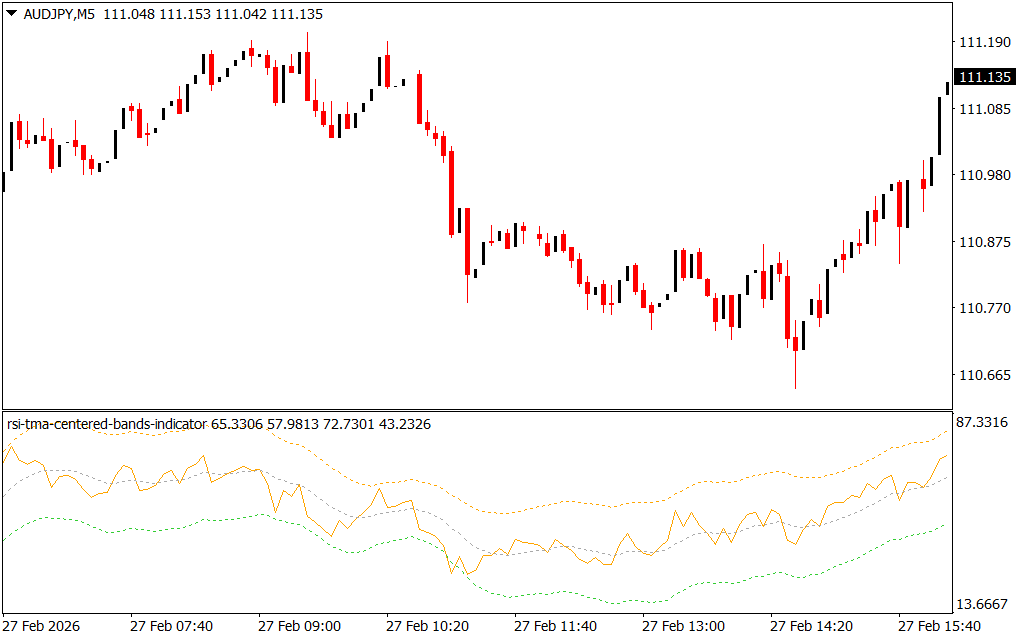
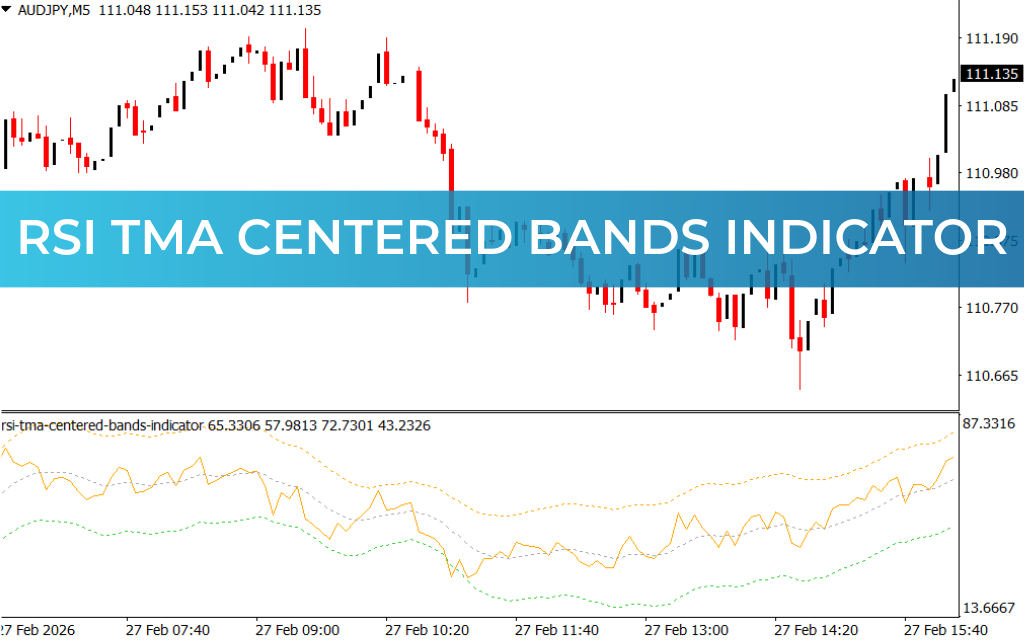
How the RSI TMA Centered Bands Indicator Works
The indicator plots:
- RSI line: Orange
- TMA bands:
- Upper band – Orange dotted line
- Midline – Grey line
- Lower band – Green line
Trading signals are generated based on the RSI line crossover with the TMA midline and the slope of the TMA bands:
- Bullish Trend:
- TMA bands angle upward
- RSI crosses above the TMA midline → buy signal
- Bearish Trend:
- TMA bands angle downward
- RSI crosses below the TMA midline → sell signal
Note: The indicator does not provide stop loss or profit target levels, so traders should manage risk by placing stops below/above previous swing points and exiting based on a good risk-reward ratio.
Benefits of RSI TMA Centered Bands Indicator
- Combines RSI and TMA for trend and momentum analysis
- Identifies overbought and oversold conditions
- Works across all chart timeframes
- Suitable for both novice and advanced Forex traders
- Provides clear entry signals based on TMA slope and RSI crossover
Conclusion
The RSI TMA Centered Bands Indicator for MT4 is an effective tool for traders seeking trend direction, momentum, and reversal signals. It highlights potential entry points and overbought/oversold conditions, making it a useful addition to any Forex trading strategy when combined with proper risk management.
FAQ
1 Download
Published:
Mar 01, 2026 07:37 AM
Category: