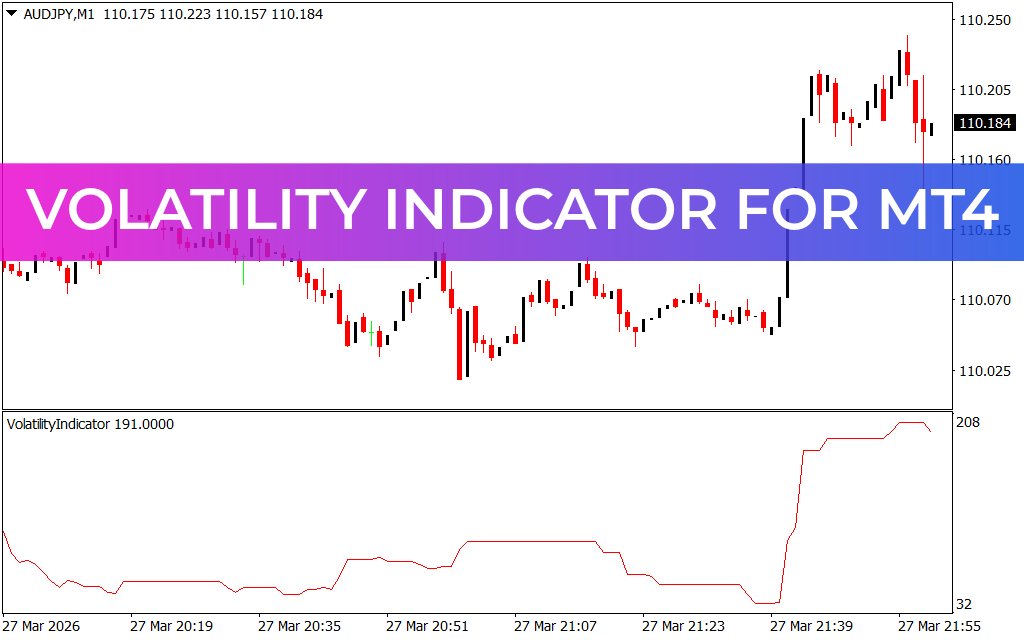
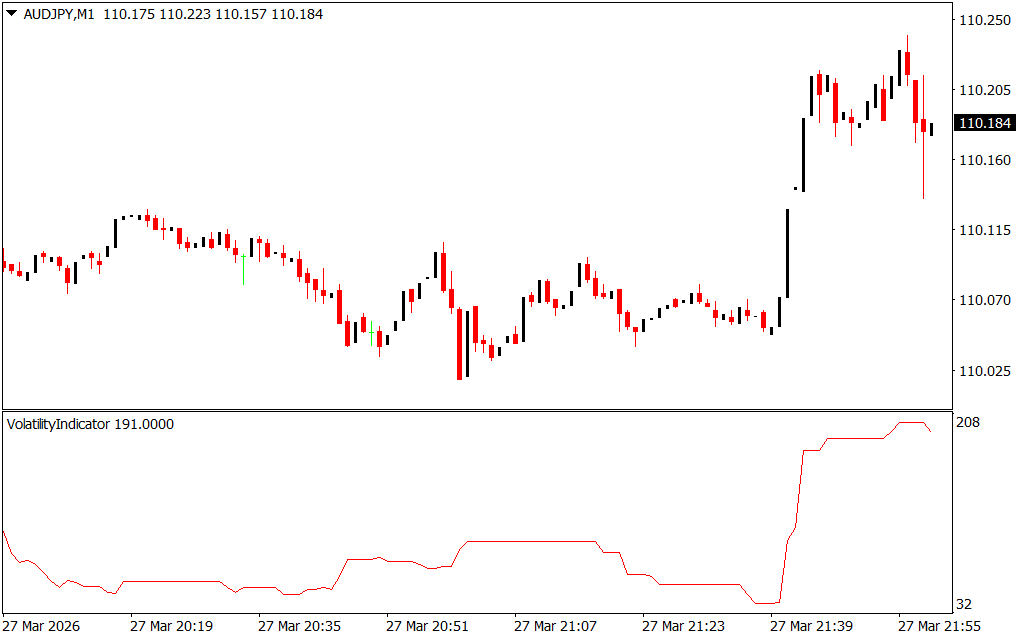
The Volatility Indicator for MT4 is a versatile and intuitive technical tool designed to help traders understand market dynamics by measuring price volatility. It shows when a market is ranging, when a major move is likely, and when trends are gaining momentum.
- Purpose: Identify ranging markets and anticipate significant market moves.
- Timeframes: Fully applicable across D1, H4, H1, M30, M15, M5, M1
- Suitable for: Forex traders, commodities, indices, and other trading assets
- Trading styles: Scalping, intraday, swing, and long-term trend trading
How the Volatility Indicator Works
The indicator evaluates price fluctuations over a defined period to gauge the current volatility of a currency pair or asset.
- Low volatility: Market is likely ranging; traders may avoid entering positions.
- High volatility: Signals the start of significant moves or trends; good opportunity for entries.
⚠️ Key Insight: By spotting periods of low activity, traders can ignore false moves and focus on high-probability trades.
Trading Benefits
- Multi-Timeframe Analysis: Identify major trend beginnings on higher timeframes while taking scalp trades on lower ones.
- Adaptable to Any Strategy: Works seamlessly with trend-following, breakout, and momentum strategies.
- Accurate Signals: Designed to generate reliable alerts, helping traders make informed decisions.
- Ease of Use: Signals are clear and easy to interpret, making it accessible for novice and experienced traders alike.
Example Usage
- On an H4 EUR/USD chart, the indicator rises sharply, signaling increased volatility. Traders may prepare for a potential breakout or trend continuation.
- On an M15 chart, low volatility is observed. Scalpers may wait or apply other strategies until volatility increases.
Conclusion
The Volatility Indicator for MT4 is a must-have tool for traders who want to measure market activity and predict potential big moves. It is highly adaptable, easy to use, and works across all timeframes and assets. Combining this indicator with other technical tools, like Moving Averages or RSI, enhances trading accuracy and decision-making.
- Free to download and easy to implement on MT4.
Meta Description
FAQ
Published:
Mar 28, 2026 21:10 PM
Category: