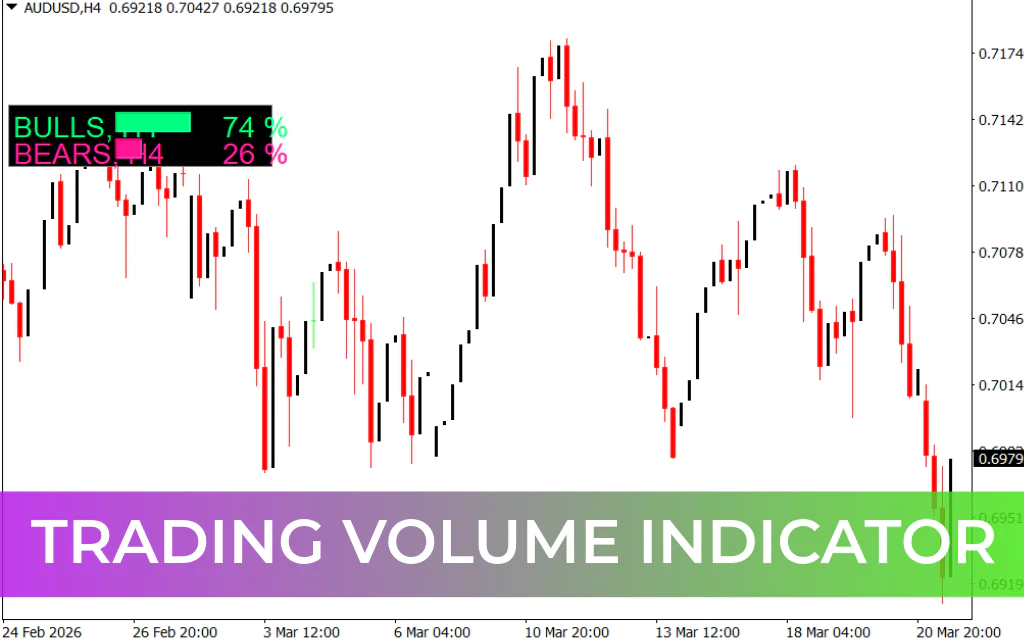
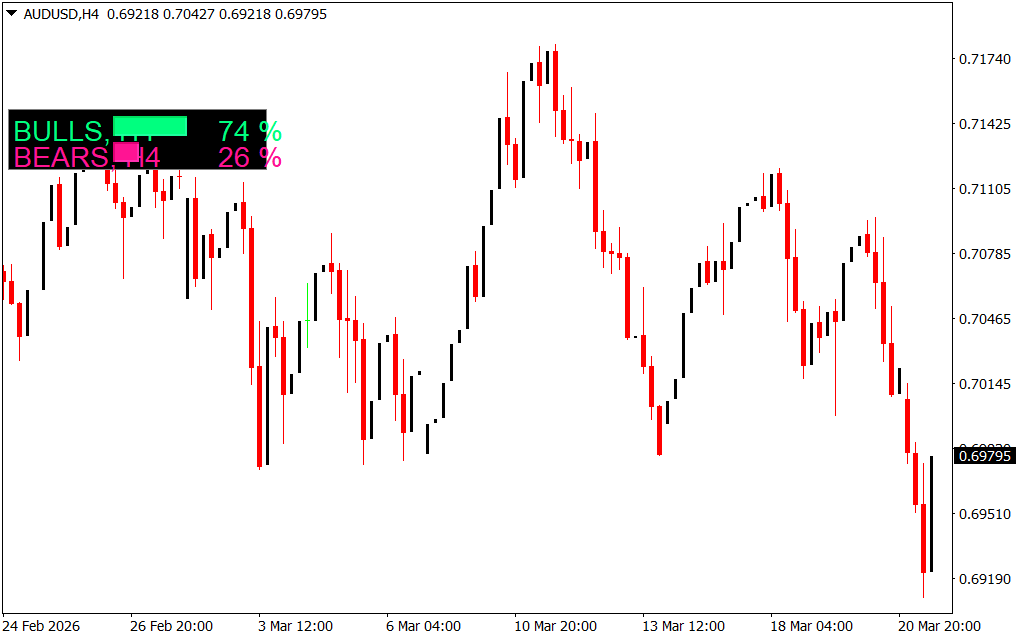
The Trading Volume Indicator for MT4 is a simple yet effective tool for analyzing overall market volume. It provides traders with a clear view of bullish and bearish activity, helping them make informed buy and sell decisions.
This indicator calculates volume based on the selected timeframe, making it suitable for Scalping, intraday, and swing trading strategies.
How the Trading Volume Indicator Works
The indicator plots a percentage-based volume graph:
- Green bars → Bullish volume
- Red bars → Bearish volume
By comparing the relative strength of bullish and bearish activity, traders can gauge the market trend and momentum.
How to Use for Buy and Sell Signals
Buy Signals
- Look for predominantly green bars
- Indicates bullish market sentiment
- Enter long positions or exit short trades
Sell Signals
- Look for predominantly red bars
- Indicates bearish market sentiment
- Enter short positions or exit long trades
For better accuracy, combine the Trading Volume Indicator with other tools like RSI, MACD, or support/resistance levels to confirm trade setups.
Advantages of the Trading Volume Indicator
- Provides a clear visual representation of market volume
- Works across all timeframes
- Helps identify Trend Strength and direction
- Beginner-friendly and easy to interpret
- Can be combined with other technical indicators for signal confirmation
Conclusion
The Trading Volume Indicator for MT4 is an essential tool for traders who want to monitor market activity and trend momentum. By analyzing bullish and bearish volume, traders can better time their entries and exits.
You can download the indicator for free and integrate it into your MT4 setup to start tracking market volume effectively.
FAQ
8 Downloads
Published:
Mar 23, 2026 08:03 AM
Category: